

Watch the How-to Video

Sessions’ Marks
You can see statistical information on sessions’ marks. (Figure 96)
 Figure 96
- Activate the Supervisor Mode if you are a supervisor of the selected class/groups.
- Use the Class/groups, Subject and Date filters to define the specific evaluation you want to see.
- Click on the Show button.
- Check out the pie chart to see the students’ session marks percentage on the selected subject.
- You can also see students’ session marks in numbers e.g. Very Good (71.00 – 85.00): 2 students.
- At the Marking List you can see the Final Overall Grade of each student per session, or essay/classwork/ exams/personal assessment marks.
Note: Use the column fields to filter or show results in ascending/descending order.
Gradebook Analysis
You can see statistical information on Term Marking. (Figure 97)
 Figure 97
- Activate the Supervisor Mode if you wish to also view subjects you are not a teacher in.
- Use the Subject and the Marking Period filters to define the specific evaluation you want to see.
- Click on the Show button.
- Check out the pie chart to see the students’ progress percentage on the selected subject e.g. Average 43.7% and the subject’s average e.g. 69.9%.
- You can also see students’ progress evaluation in numbers e.g. Average (50.00 – 70.00): 7 students.
- At the Marking List you can see marks analysis for all students of the selected group for the selected marking period.
Note: Use the column fields to filter or show results in ascending/descending order.
Assessments & Assignments
You can see statistical information on the students’ assessments for the selected group and subject. (Figure 98)
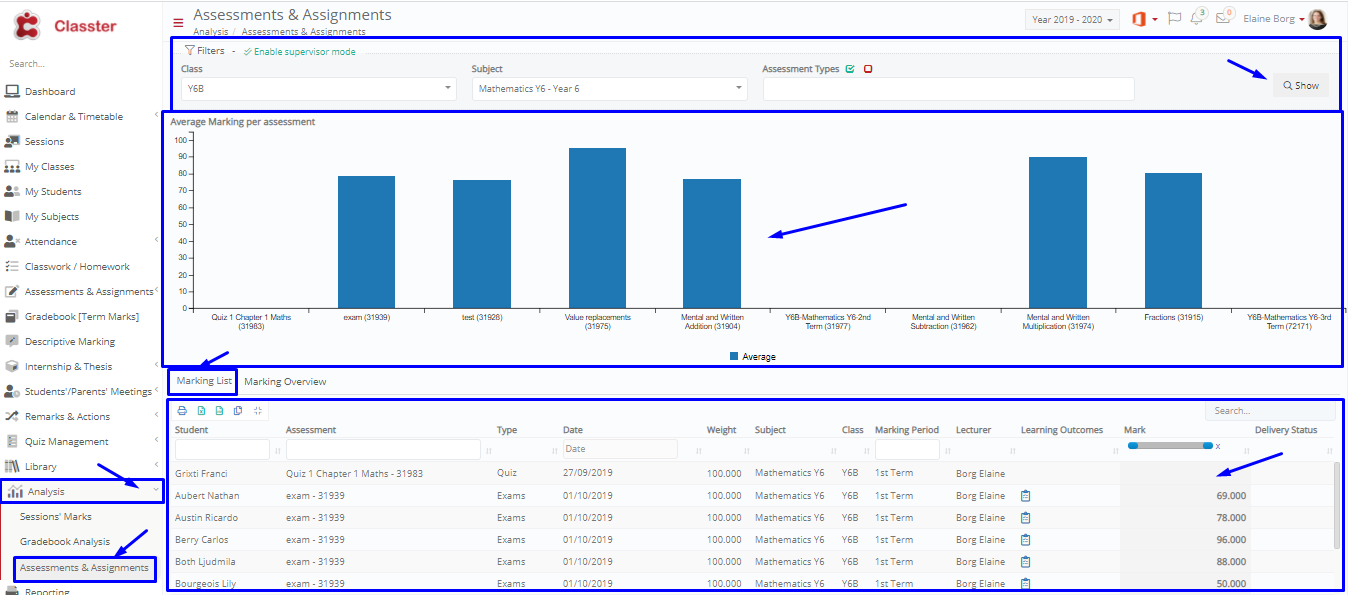 Figure 98
- Activate the Supervisor Mode if you wish to view class/group, subjects you are a supervisor for.
- Use the Class/Group and the Subject filters to define the specific assessments evaluation you want to see.
- Click on the Show button.
- Check out the columns chart to see the average marks per assessment e.g. Y6B-Mathematics Y6: 76.25
![]()
- At the Marking List you can see all the assessments and extra info of each student for the selected group and subject.
Note: Use the column fields to filter or show results in ascending/descending order.