

Gradebook (Term Marks)
You can record or edit students’ marks for the selected group, subject and marking period (Figure 318).
- Use the filters to show students
- Record or edit student’s classwork, exams, and personal assessments marks. As a result, you have student’s Final overall grade calculated, according to the selected marking scenario.
Note: The Final Overall Grade is editable. Therefore, although for example you can change a student’s overall grade from 60% to 70%.
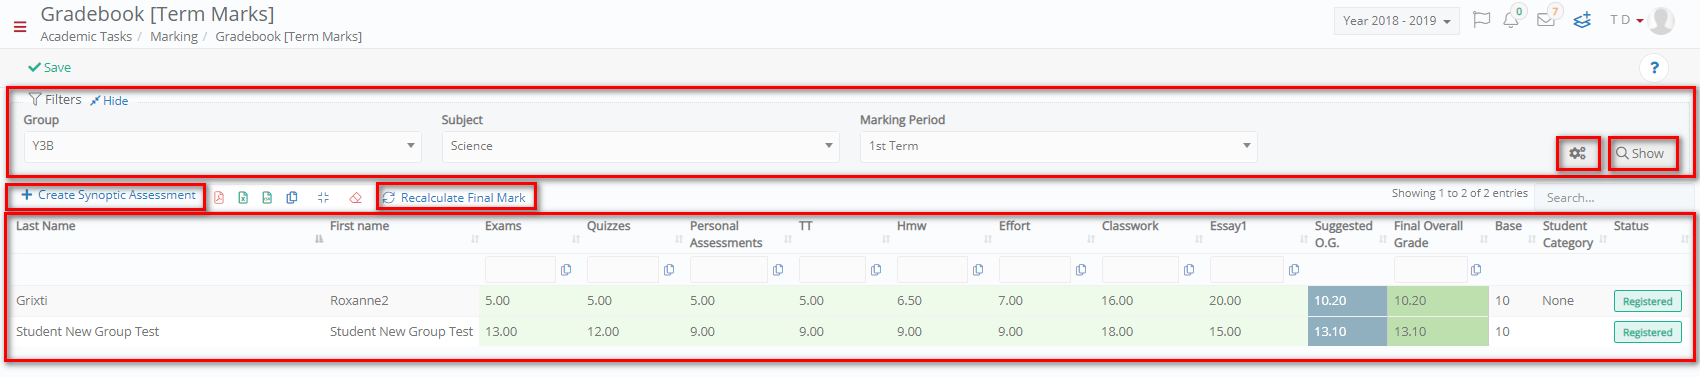
Figure 318
- Click on the Recalculate Final Marks button to make the system recalculate final overall grade.
- If you have entered new marks click on the ‘Save Recalculated Marks’ button.
- Switch on the synoptic mode button if you wish to see Term Marks for Synoptic assessments.
- Click on the ‘Annual Results Model’ button to either select another marking scenario from the list of existing ones (Figure 319), or create a new marking structure (Figure 320).
Note: The marking structure cannot be edited if there are marks for this subject in this marking period.
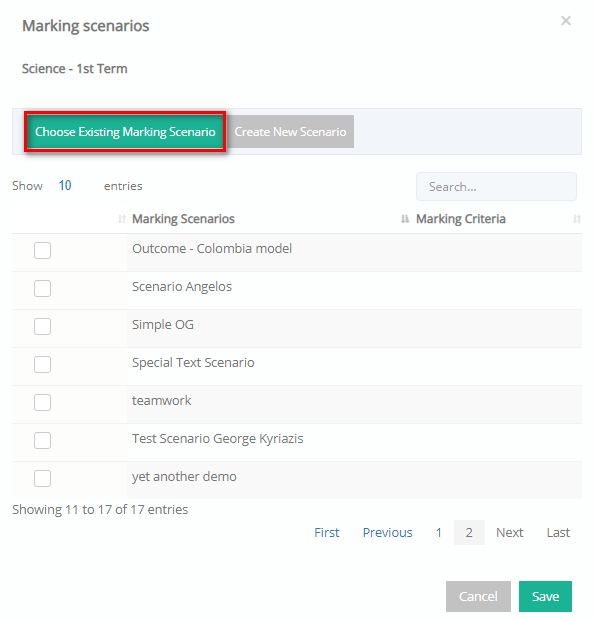
Figure 319
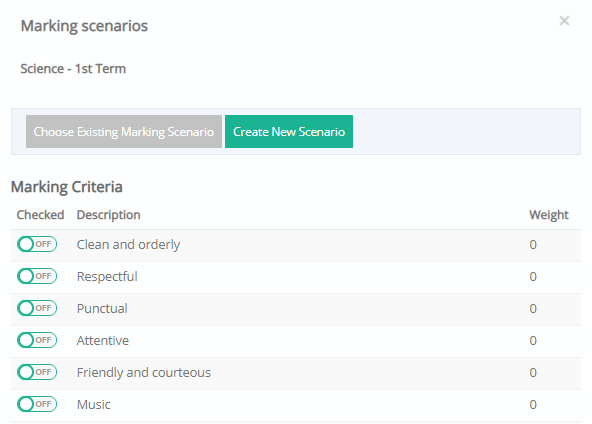
Figure 320
- Click on ‘Create Synoptic Assessment’ button to create a new synoptic assessment. This can be done for students who failed an assignment for an acceptable reason and receive a second chance.
Descriptive Marking
You can record or edit student’s descriptive marking e.g., effort grade, strengths, weakness etc.
- Use the filters to manage results per student, per descriptive category or per marking period.
- Record or edit student’s descriptive marks. Select a mark from the available drop-down list or click on the text field to enter comments (Figure 321).
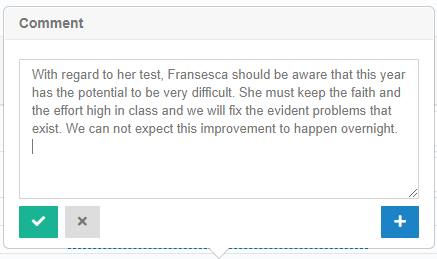
Figure 321
Per Student
Use the filters to select Group e.g., S1A, Subject e.g., Social and Personal Development and Student e.g., StudentS1 TestS1 (Figure 322).
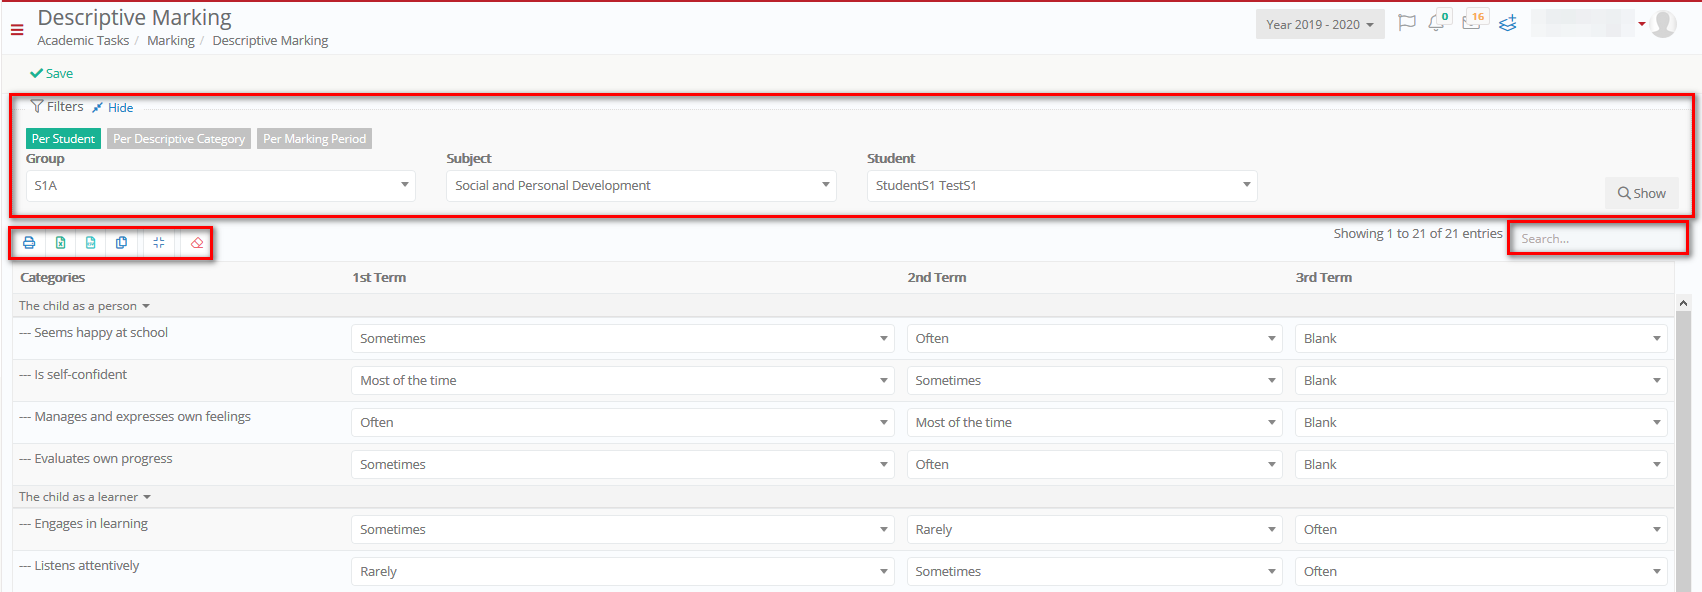
Figure 322
Per Descriptive category
Use the filters to select Group e.g., S1A, Subject e.g., Social and Personal Development and Marking Criteria e.g., Seems happy at school (Figure 323).
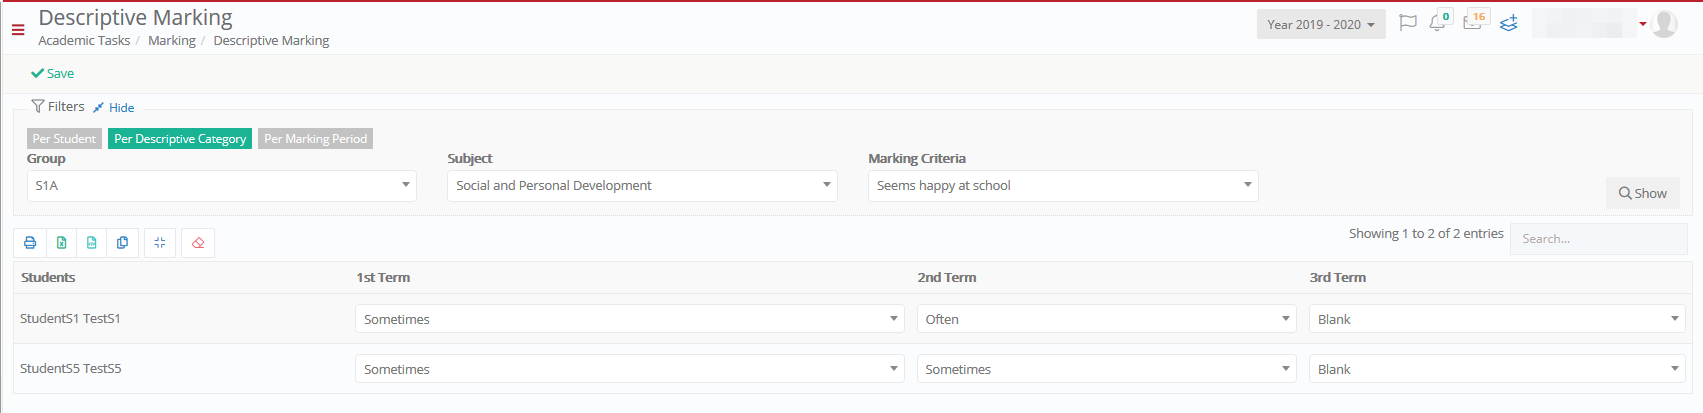
Figure 323
Per Marking Period
Use the filters to select Group e.g., S1A, Subject e.g., Social and Personal Development and Marking Period e.g., 1st Term (Figure 324).
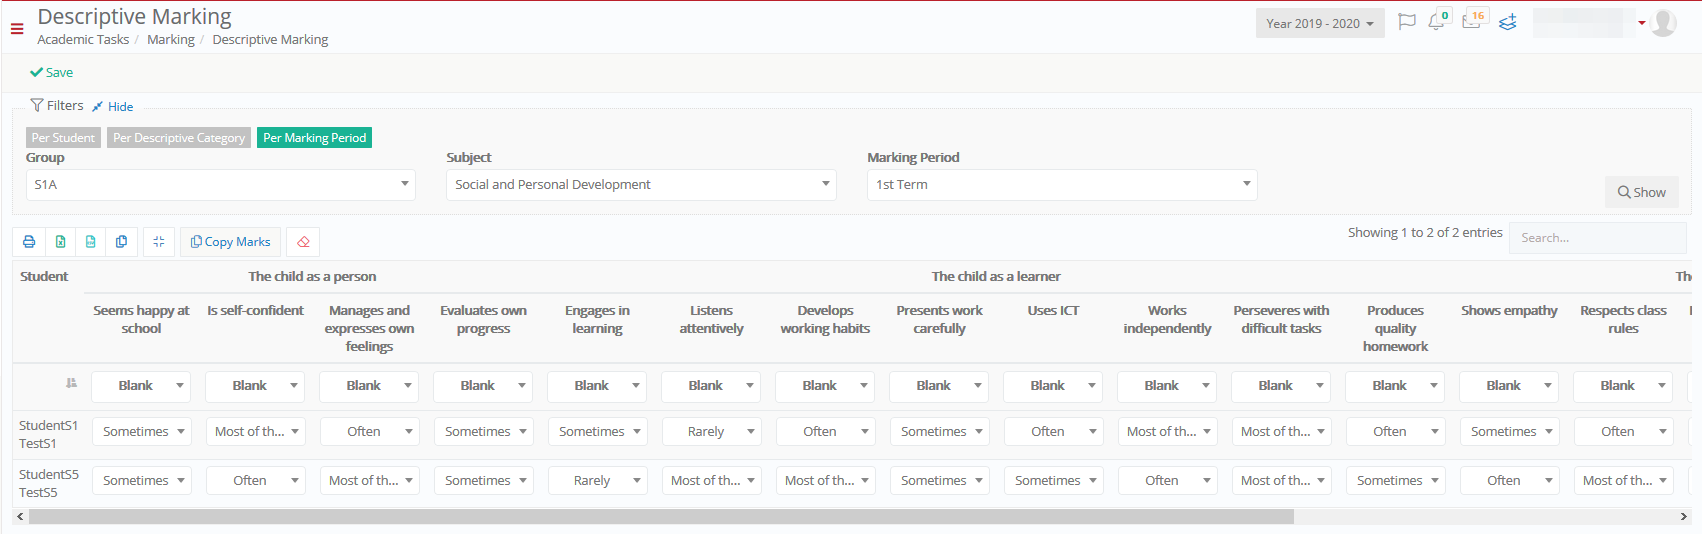
Figure 324
- Click on ‘Copy Marks’ button to copy marks to a different marking period (Figure 325).
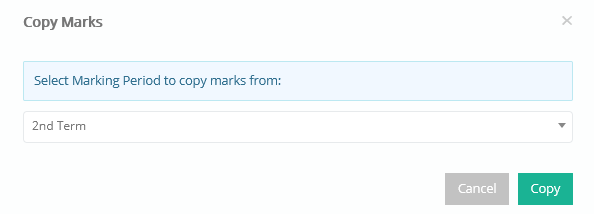
Figure 325
Entrance Assessments
You can register or edit entrance assements marks of candidate students who are waiting for registration (Figure 326).
- Click on the ‘Recalculate Final Mark’ button to recalculate overall final grade, if you manually added or changed marks.
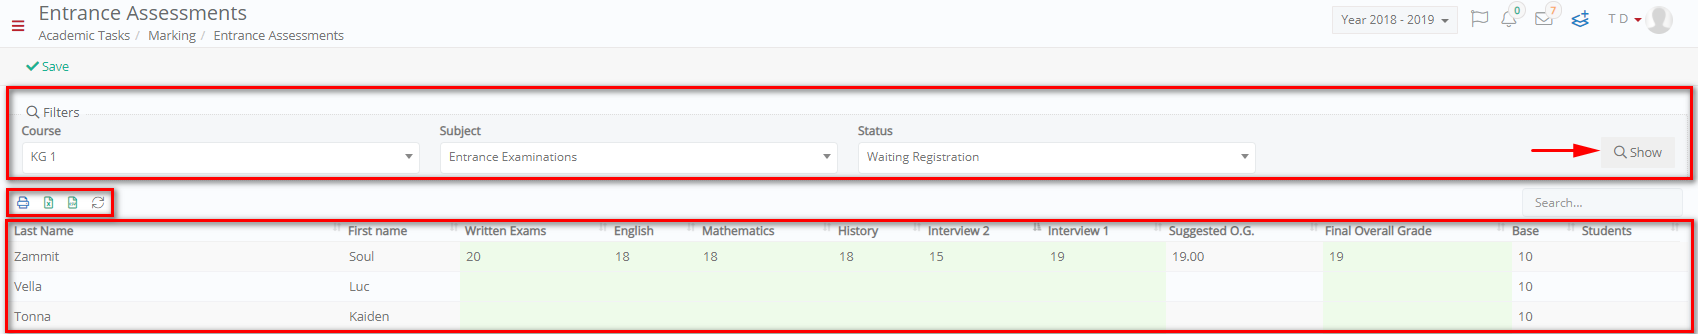
Figure 326
Marking Results
You can show students’ marking results and you can print reports concerning student’s marks and assessments (Figure 327).
- Use the filters to select Marking Period e.g., Mid-Term 1, Marking Criteria e.g., Classwork, Homework, Exams etc., Year e.g., Year 4, Class e.g., Y4B and Subject e.g., English. Additionally, select how you want the results sorted by e.g., Student and if you want to include Descriptive marks turn the switch on.
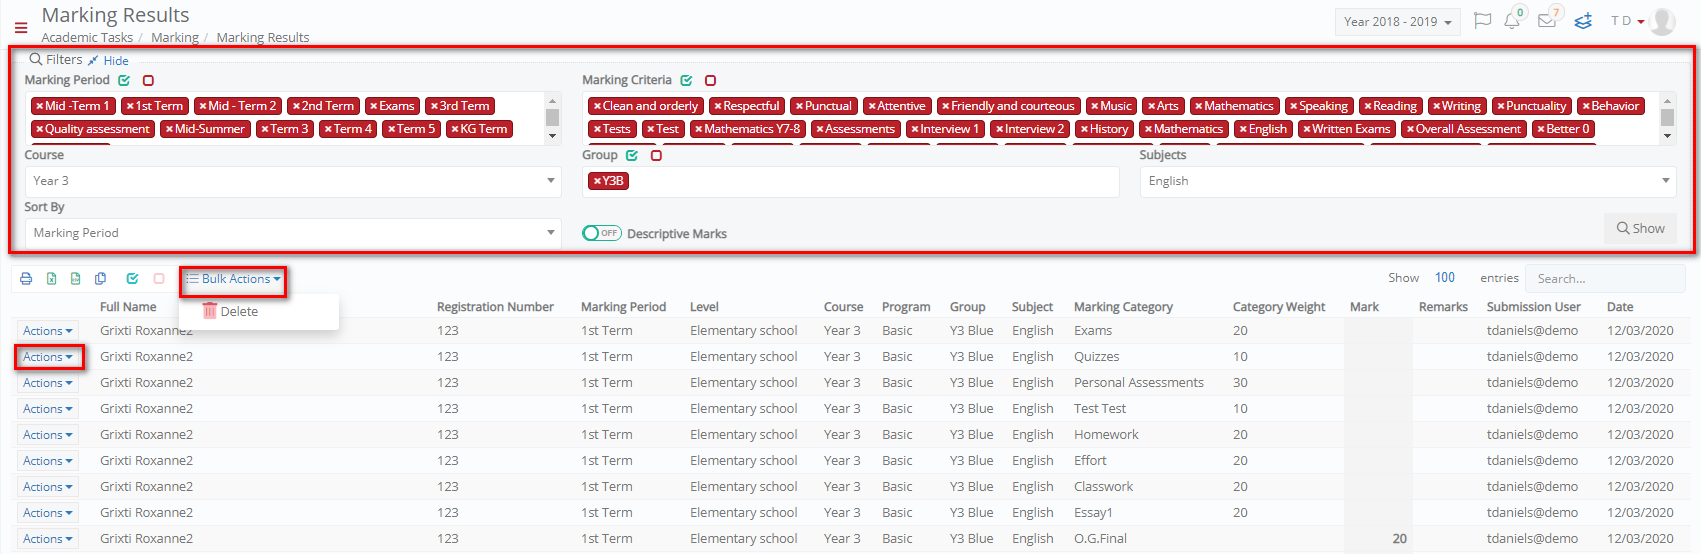
Figure 327
- Use the delete option in the ‘Bulk Actions’ and ‘Actions ‘button’ to delete multiple or individual rows, respectively.
- Use relevant buttons to print or export the results.
At the top of the page:
- Use the ‘Auto Calculate Term Marks’ button from the ‘Actions’ menu to automatically calculate term marks for students.
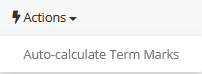
Figure 328
- Use the ‘Reports’ button to print or export reports presenting in detail students’ marking results (Figure 329) e.g., Final Marks per Group and Subject (Figure 330).

Figure 329
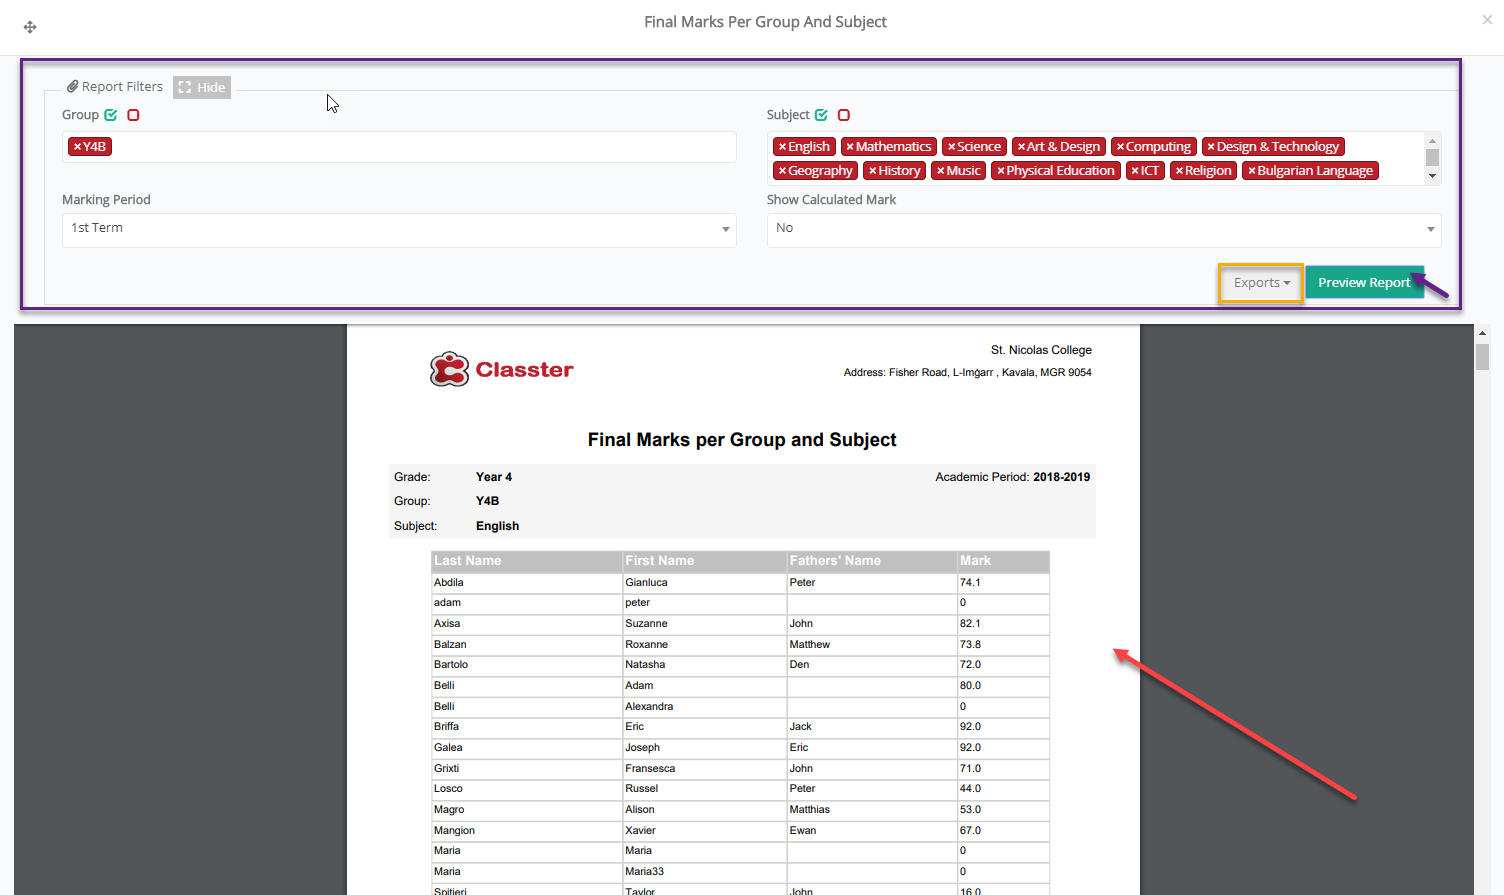
Figure 330
Gradebook Analysis
You can show mark analysis for the selected marking period and the selected subject the students are enrolled in (Figure 331).
- Use the grade, subject and marking period filters to show results.
- You can see results in a graph, presenting percentage of students that are excellent, very good, average or fail in the selected subject i.e., Very Good 33.7%. Next to the graph you can see the detailed information in numbers i.e., 28 students are very good. Additionally, you can see the subject’s average i.e., 63.3.
MARKING LIST
In the Marking List you can see analytically the students’ marks.
Note: You can use the columns to filter or classify the results. The number in brackets next to each column (e.g., Essay, Classwork, Exams and Personal Assessment) is the category weight.
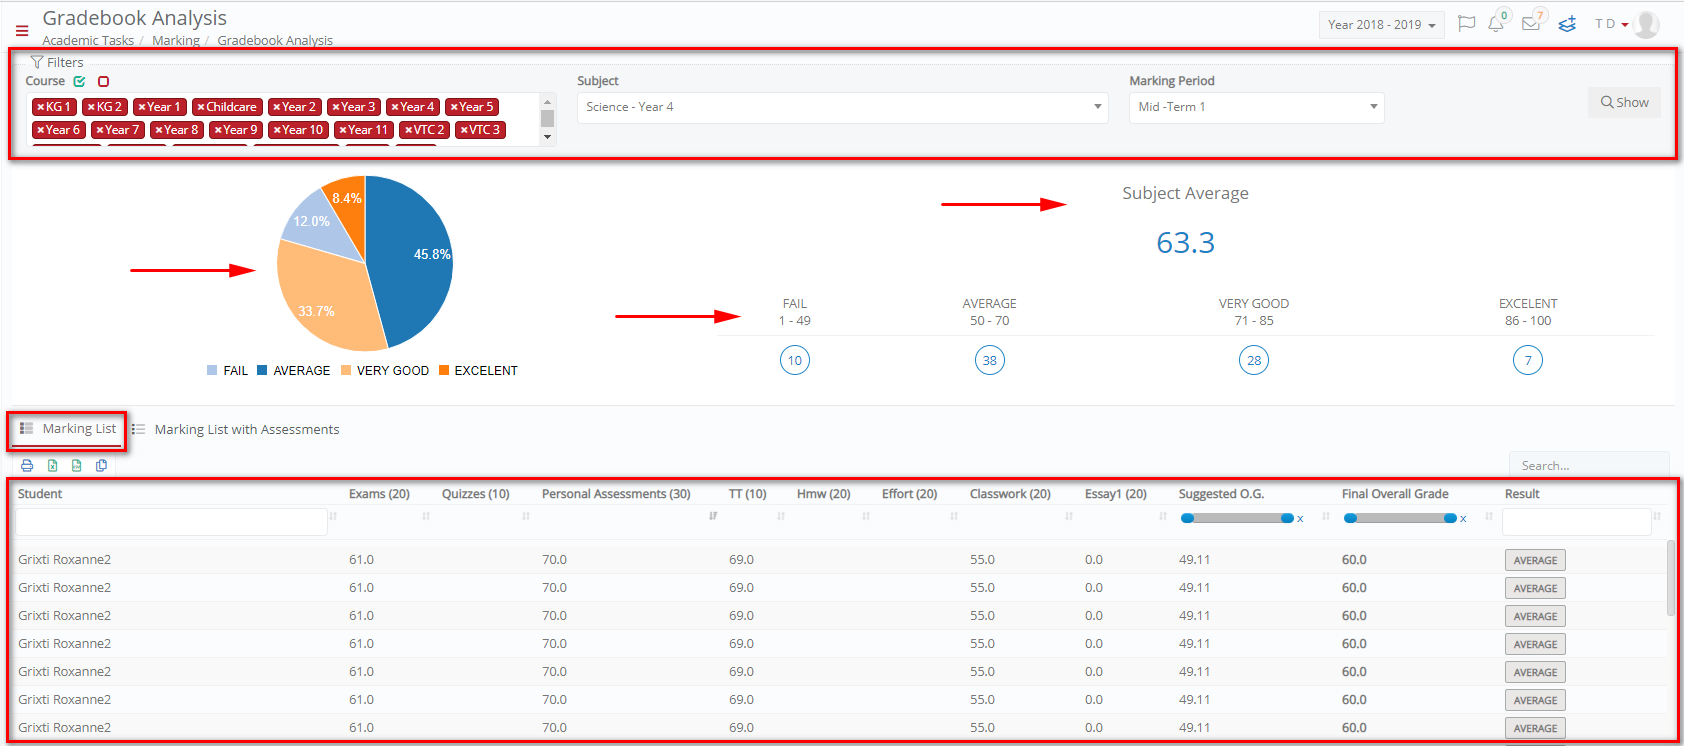
Figure 331
MARKING LIST WITH ASSESSMENTS
Under the Marking List with Assessments tab, you can see the assessments that contributed to the marking results.
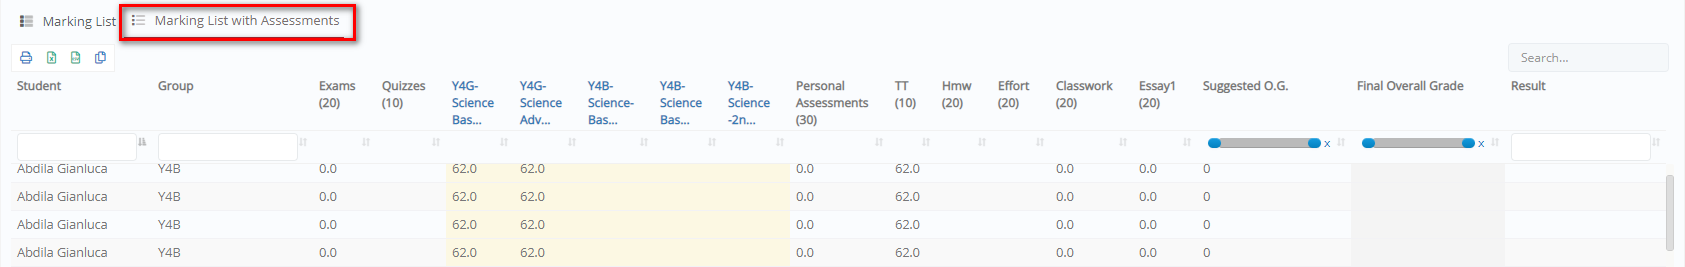
Figure 332
Descriptive Marks Analysis
You can show student’s descriptive mark analysis (e.g., grades, strengths, weaknesses etc.) Answer per Student, Distribution of Answers, or Growth Per Criteria.
Answers Per Student
Use the filters to select the Grade e.g., Year 4, Group e.g., Y4B, Subject e.g., English-Year 4 and Marking Period e.g., 1st Term (Figure 333).
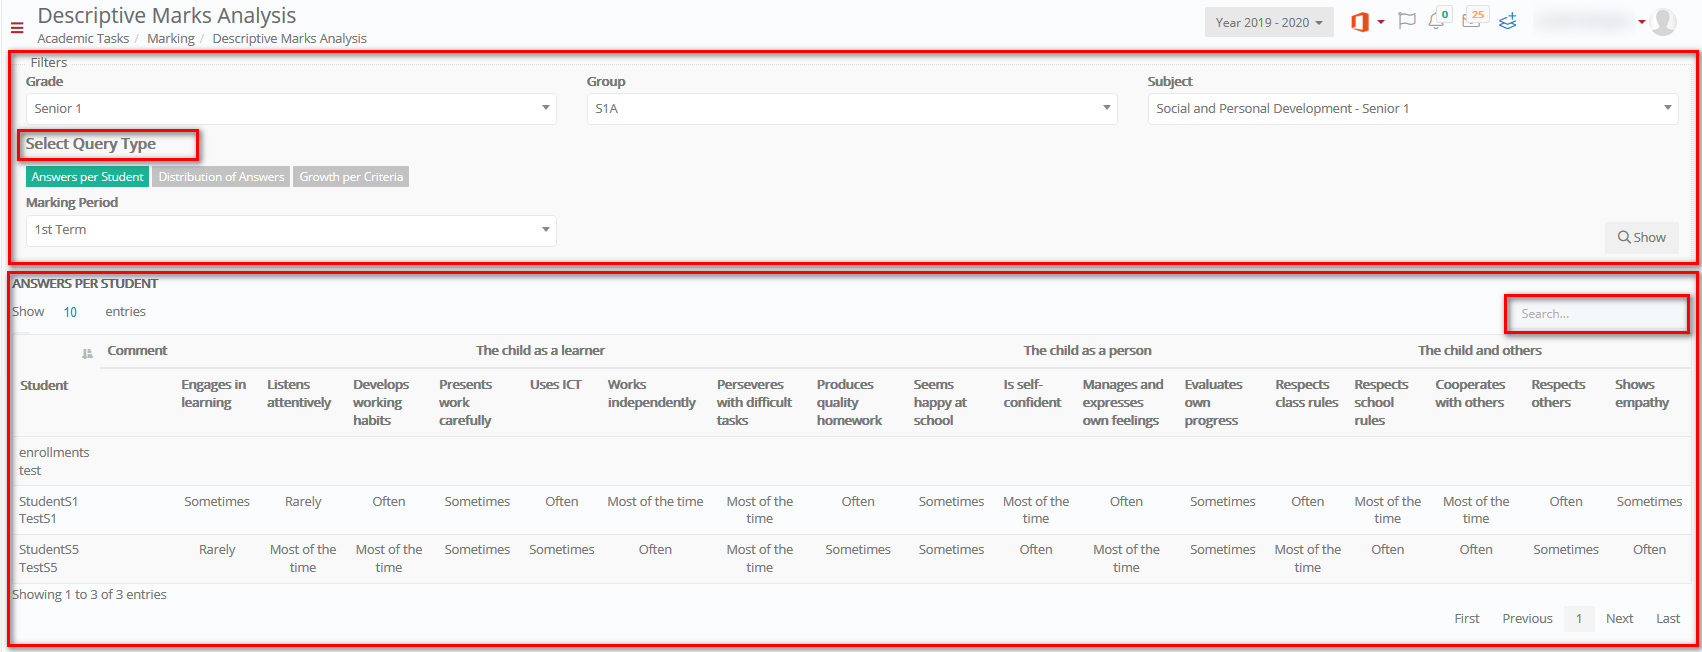
Figure 333
Note: Click on blue colored text to see the whole comment (Figure 334).
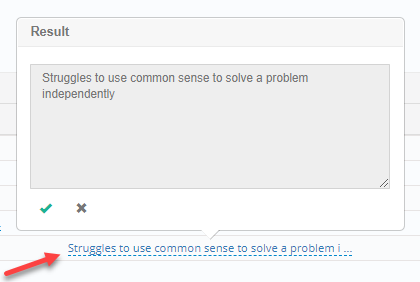
Figure 334
Distribution of Answers
The per distribution of answers displays the percentage of answers for each descriptive mark in a pie chart (Figure 335).
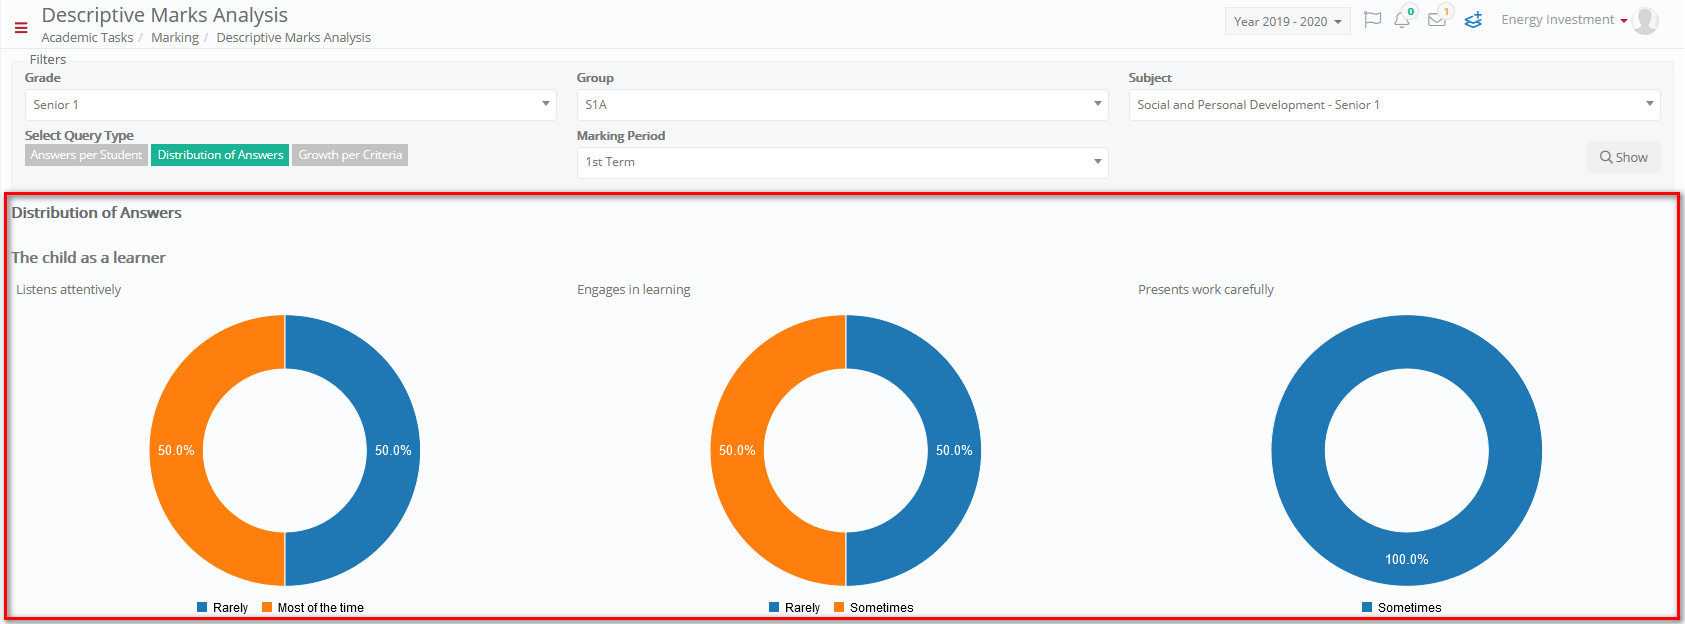
Figure 335
Growth Per Criteria
The growth per criteria view shows the students’ growth in each criterion per term (Figure 336).
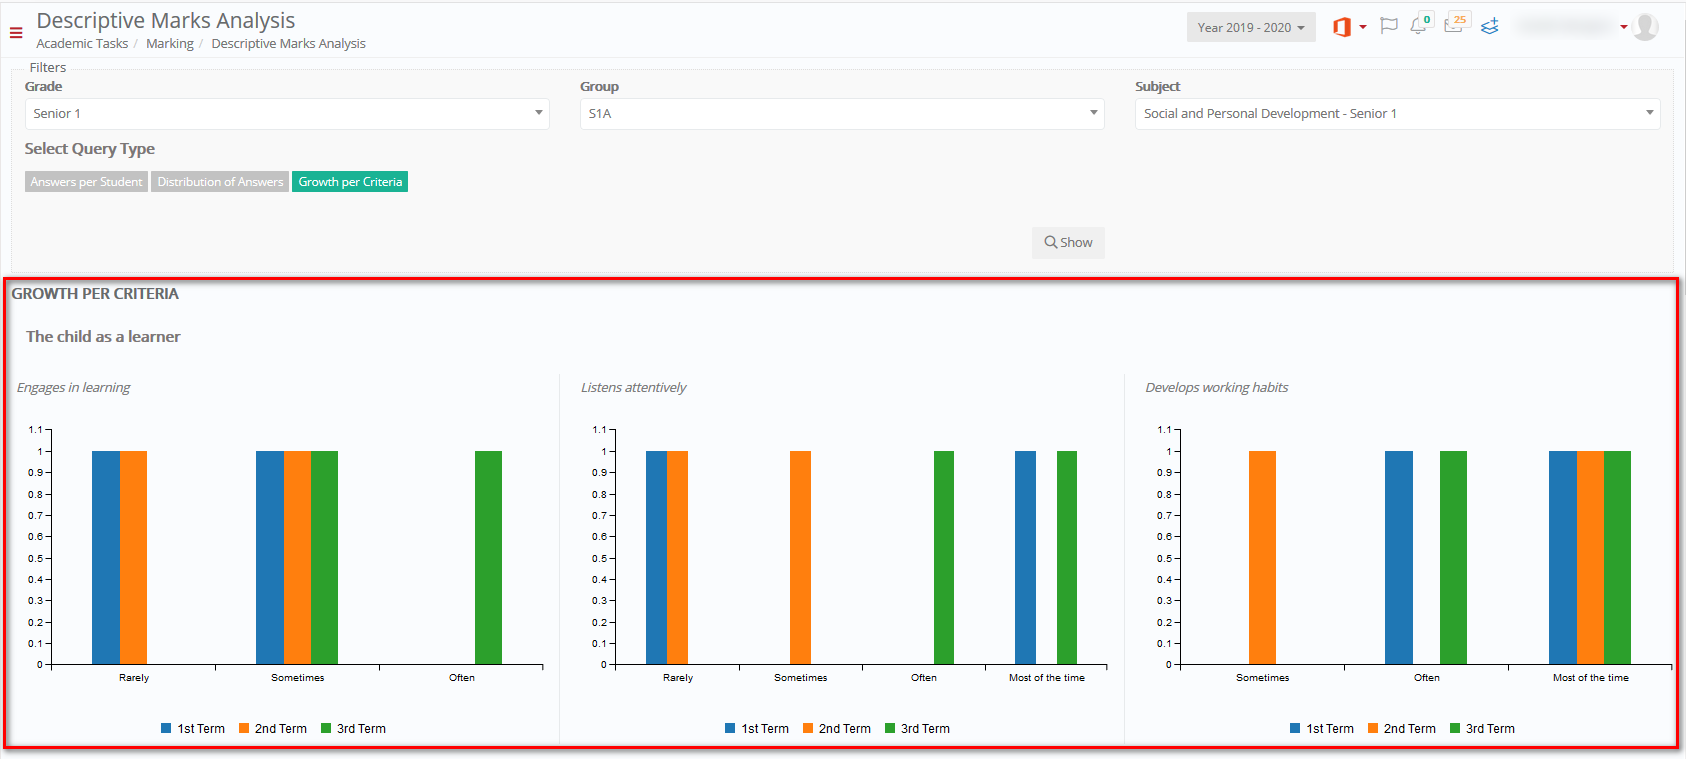
Figure 336
Overall Annual Result
In this section, you can view and manage the students’ overall marks at the end of the academic year.
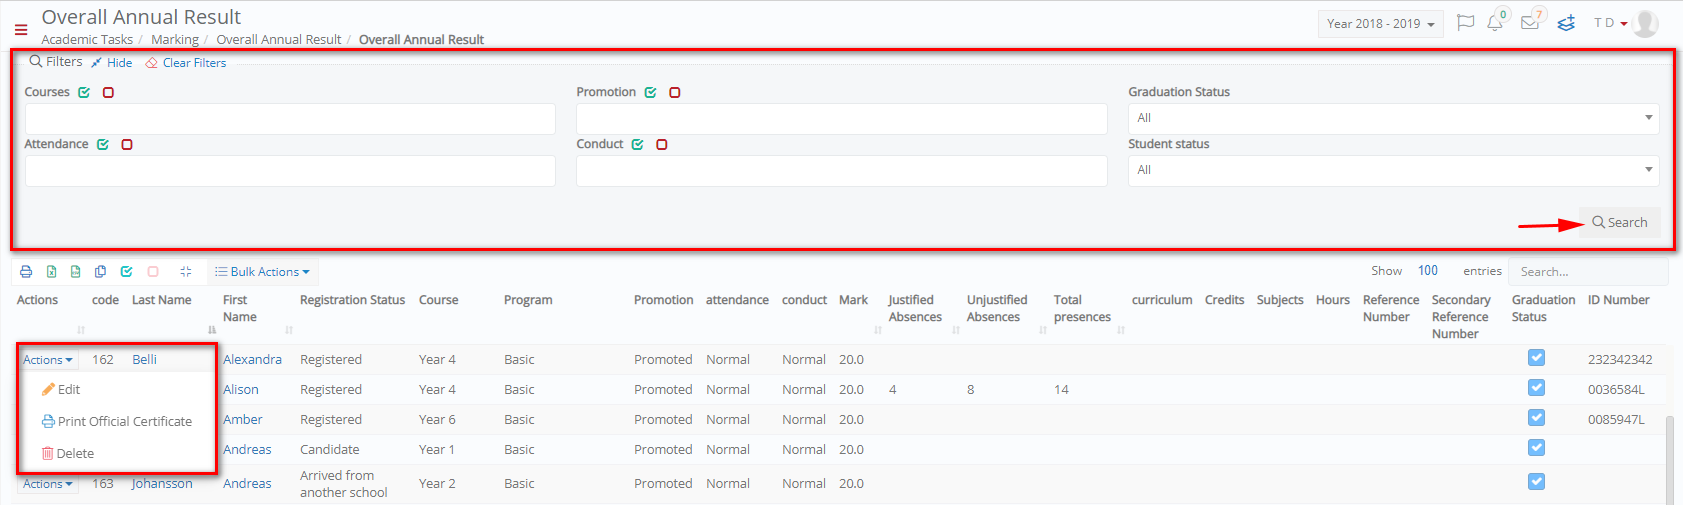
Figure 337
- In the action button next to a student, click on edit to update the student’s annual result.
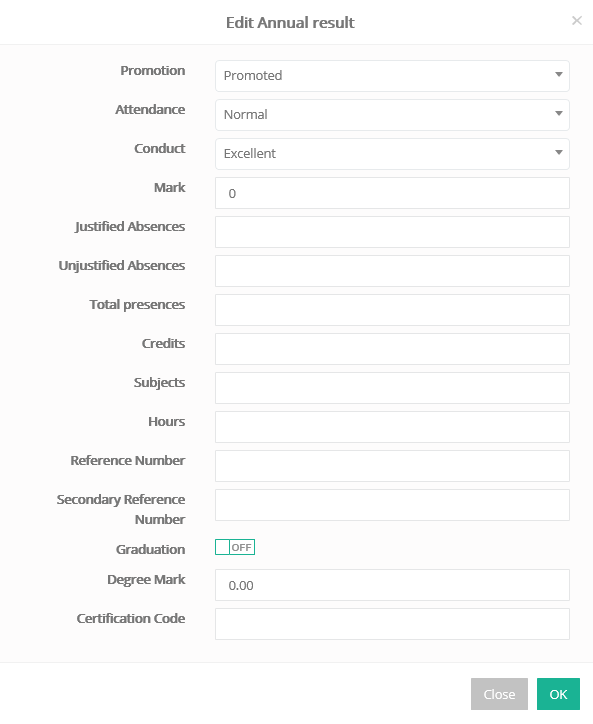
Figure 338
You can also use the Bulk Actions (Figure 339) to calculate the annual results (Figure 340) and change the status of multiple students, for example, from Registered to Graduated (Figure 341).
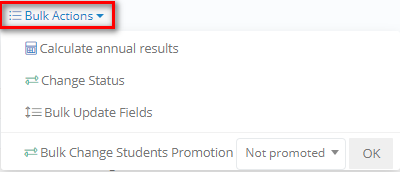
Figure 339

Figure 340
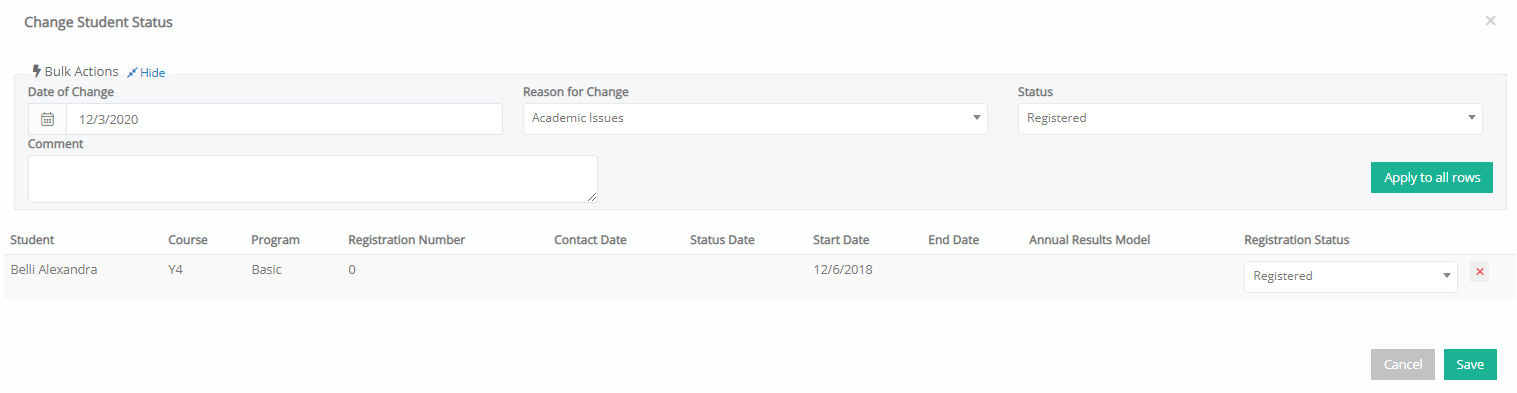
Figure 341
Use the bulk update fields option to update the same fields for multiple users (Figure 342).
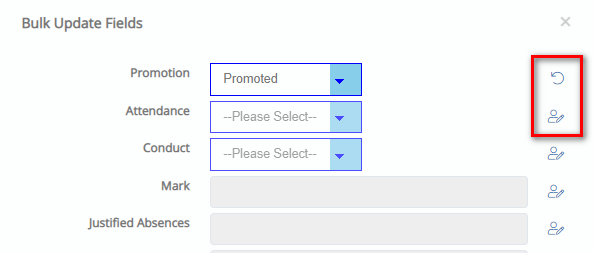
Figure 342