

You can see and edit all cases of students’ marks (Figure 20).
Figure 20
Gradebook [Term Marks]
You can record or edit students’ marks for the selected group, subject and marking period (Figure 21).
-
-
- Use the filters to show students
- Record or edit student’s classwork, exams and personal assessments marks. As a result, you have student’s overall grade (O.G. Free) calculated, according to the selected marking scenario.
-
Note: The O.G. Free is editable. Therefore, although for example a student’s overall grade is 65.67%, you can change it to 39%.
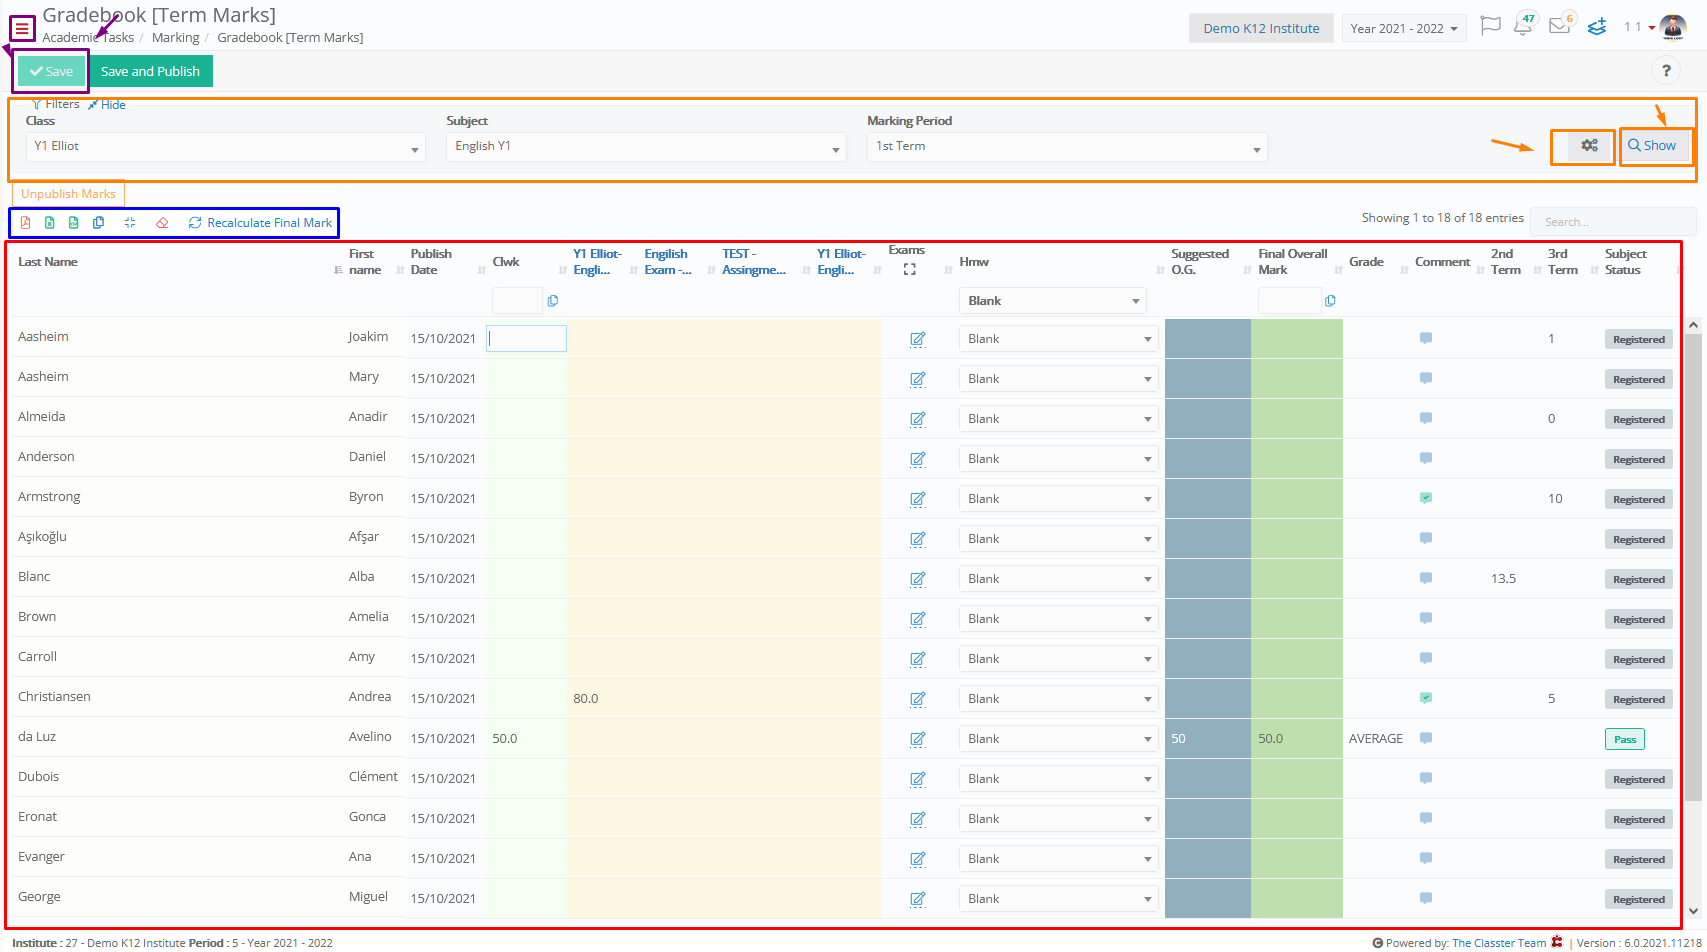
Figure 21
- Click on the ‘Edit Grading Structure’ button to either select another marking scenario from the existing ones (Figure 22), or create a new marking structure (Figure 23).Note: The marking structure cannot be edited if there are marks for this subject in this marking period.
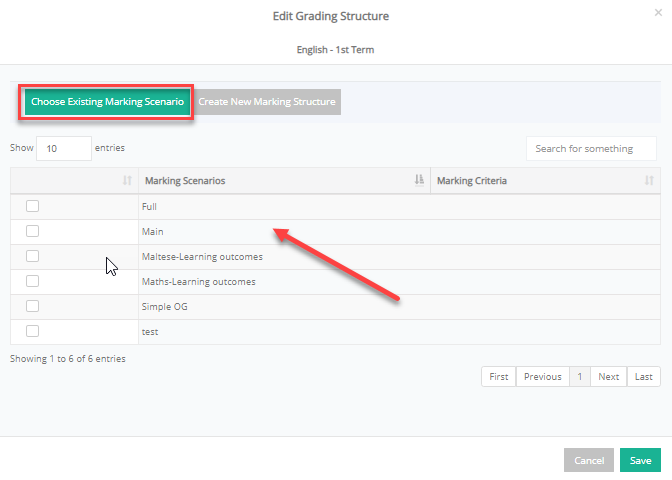
Figure 22
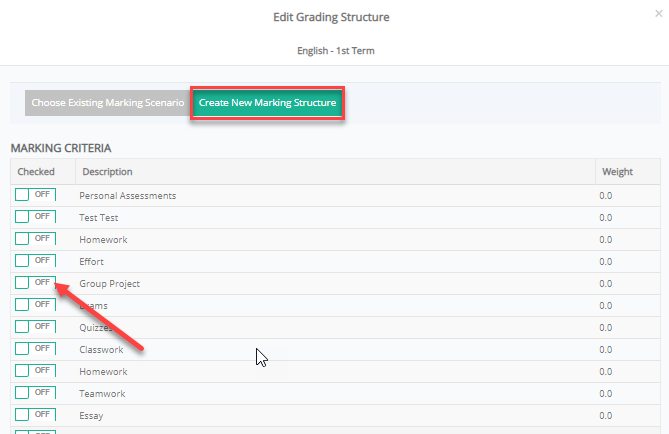
Figure 23
Descriptive Marking
You can record or edit student’s descriptive marking e.g. effort grade, strengths, weakness etc.
- Use the filters to manage results per student, per descriptive category or per marking period.
- Record or edit a student’s descriptive marks. Select a mark from the available drop-down list or click on the text field to enter comments (Figure 24).
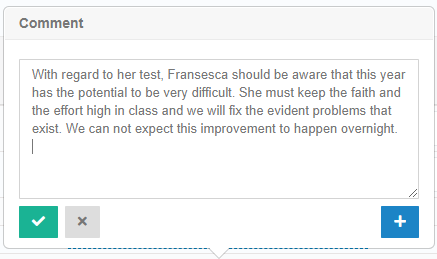
Figure 24
Per Student
- Use the filters to select Group/Class e.g. Y4B, Subject e.g. Mathematics and Student e.g. Francesca Grixti (Figure 25).
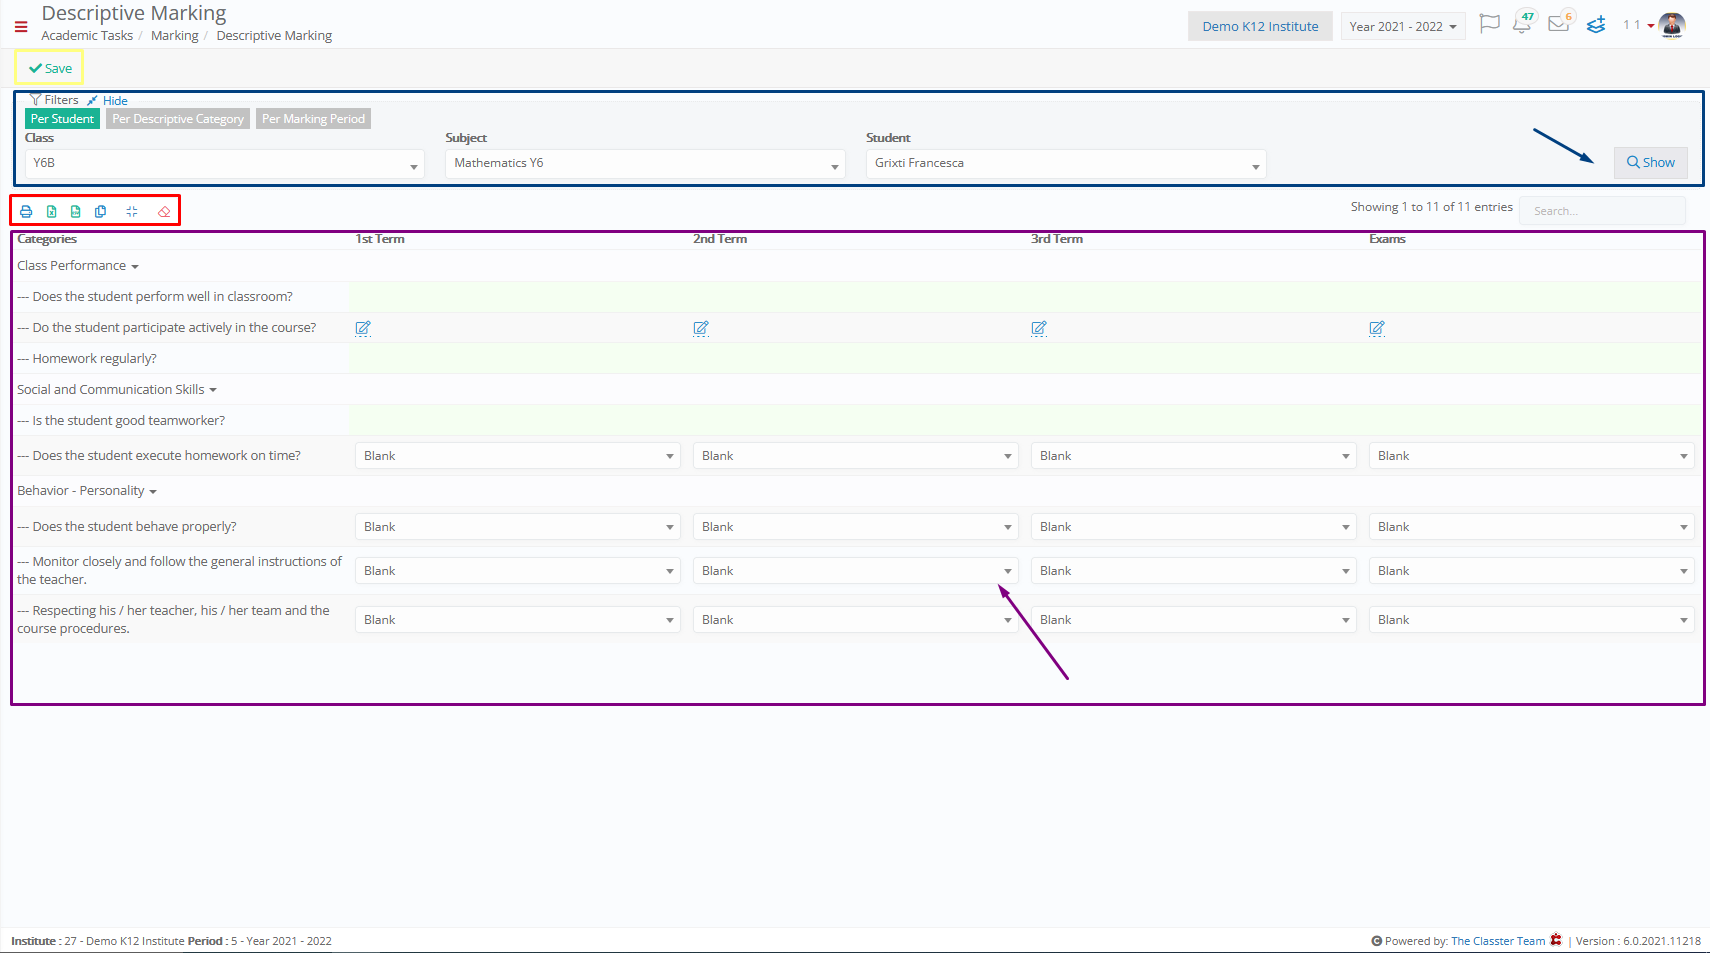
Figure 25
Per Descriptive category
- Use the filters to select Group/Class e.g. Y4B, Subject e.g. Mathematics and Marking Criteria e.g. Strengths (Figure 26).
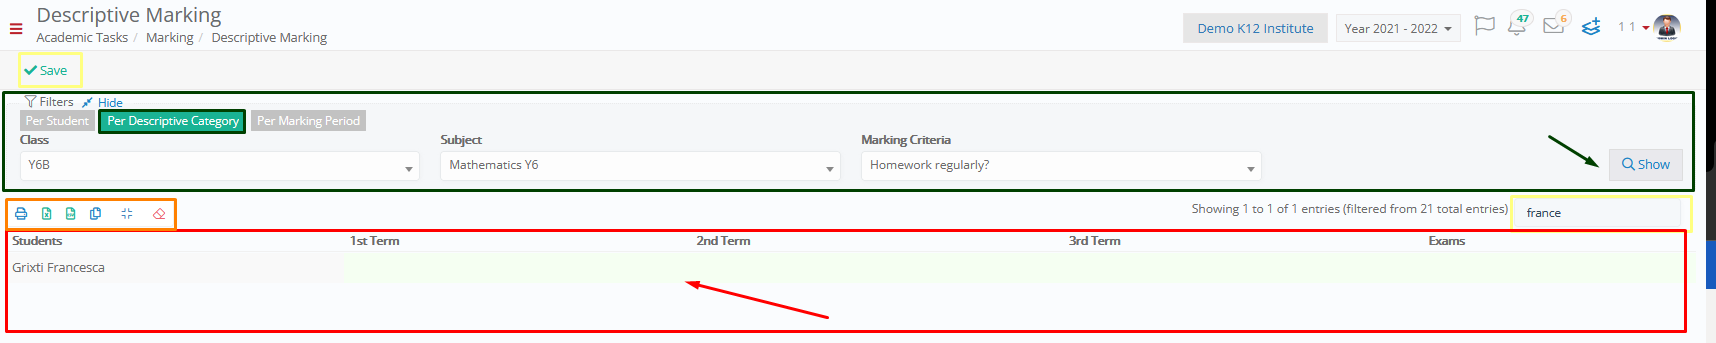
Figure 26
Per Marking Period
Use the filters to select Group/Class e.g. Y4B, Subject e.g. Mathematics and Marking Period e.g. Mid-Term 1 (Figure 27).
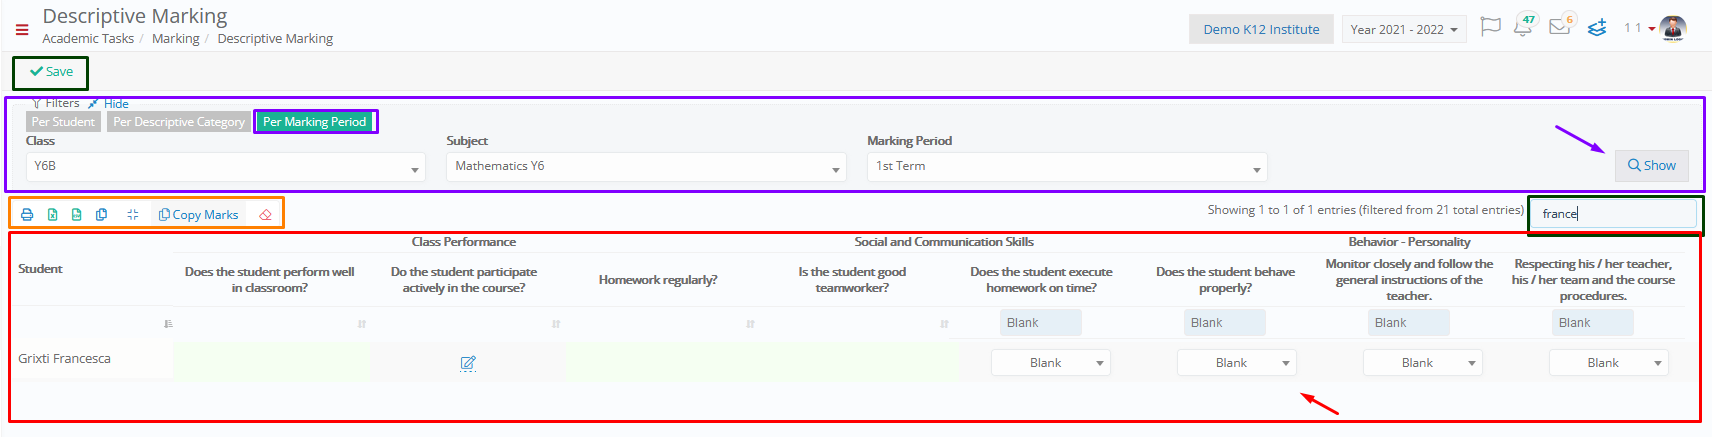
Figure 27
Entrance Assessments
You can register or edit entrance assements marks of candidate students who are waiting for registration (Figure 28).
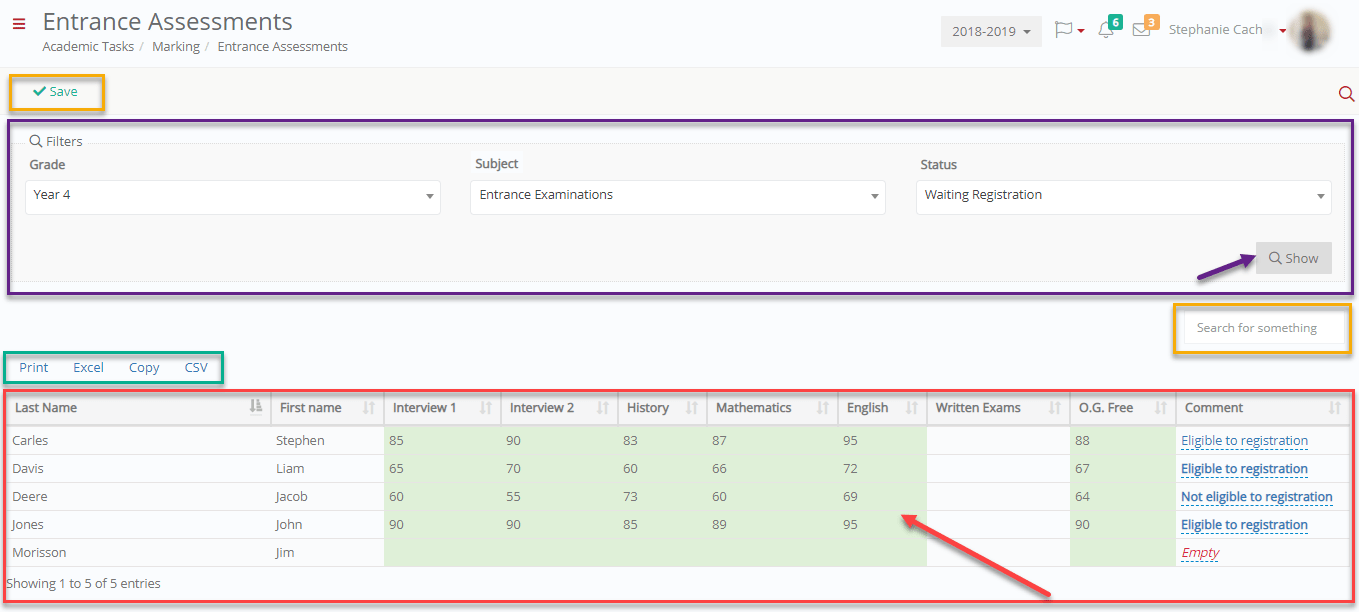
Figure 28
Marking Results
You can show students’ marking results and you can print reports concerning student’s marks and assessments (Figure 29).
Use the filters to select Marking Period e.g. Mid-Term 1, Marking Criteria e.g. Classwork, Homework, Exams etc., Grade e.g. Year 4, Group/Class e.g. Y4B and Subject e.g. English. Additionally, select how you want the results sorted by e.g. Student.
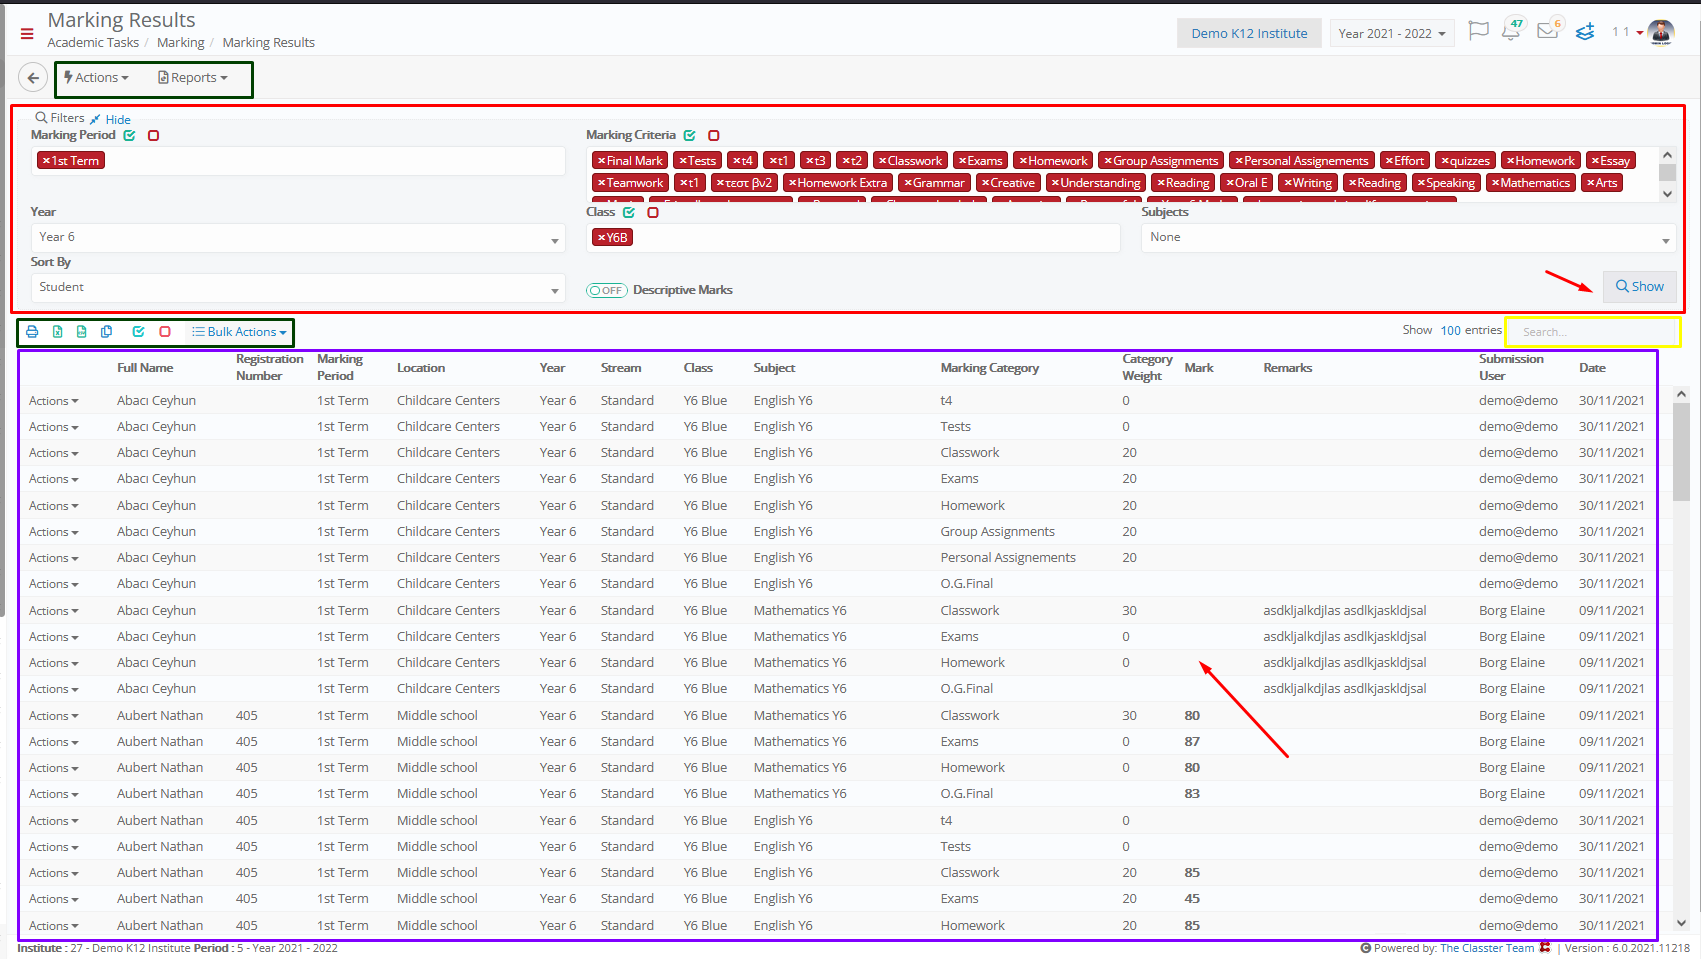
Figure 29
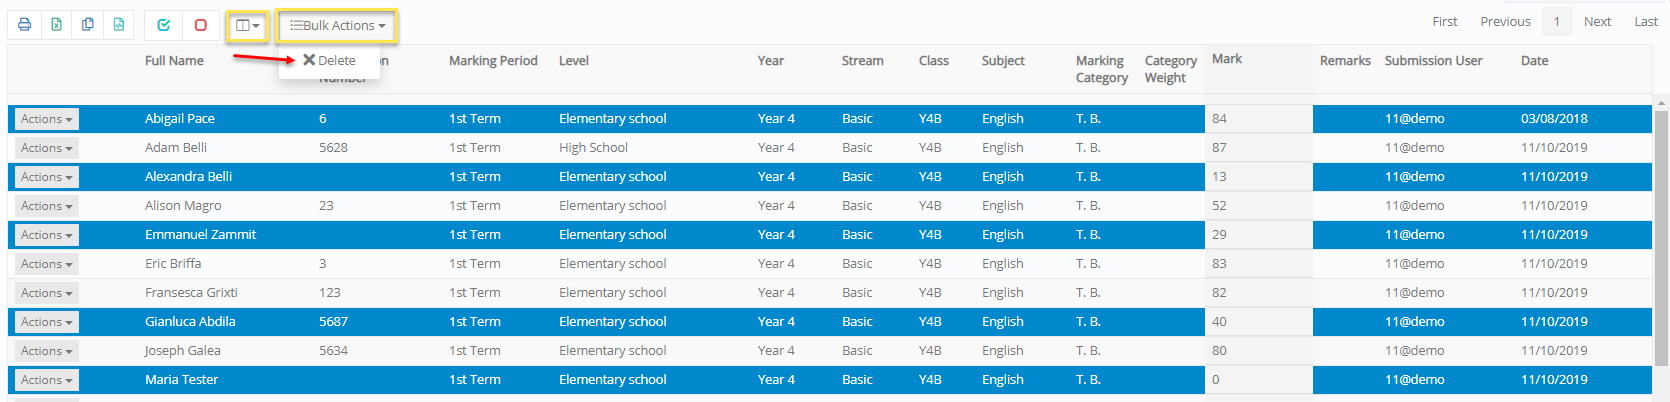
Figure 30
Use the ‘Bulk Actions’ button’ to delete selected rows (Figure 30).
- Use the ‘Manage Columns’ button to show/hide information e.g. Program
- Use relevant buttons to print or export the results
- Use the ‘Reports’ button to print or export reports presenting in detail students’ marking results (Figure 31) e.g. Final Marks per Group and Subject (Figure 32).
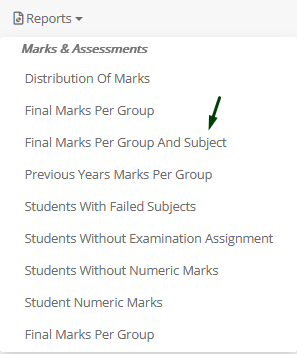
Figure 31
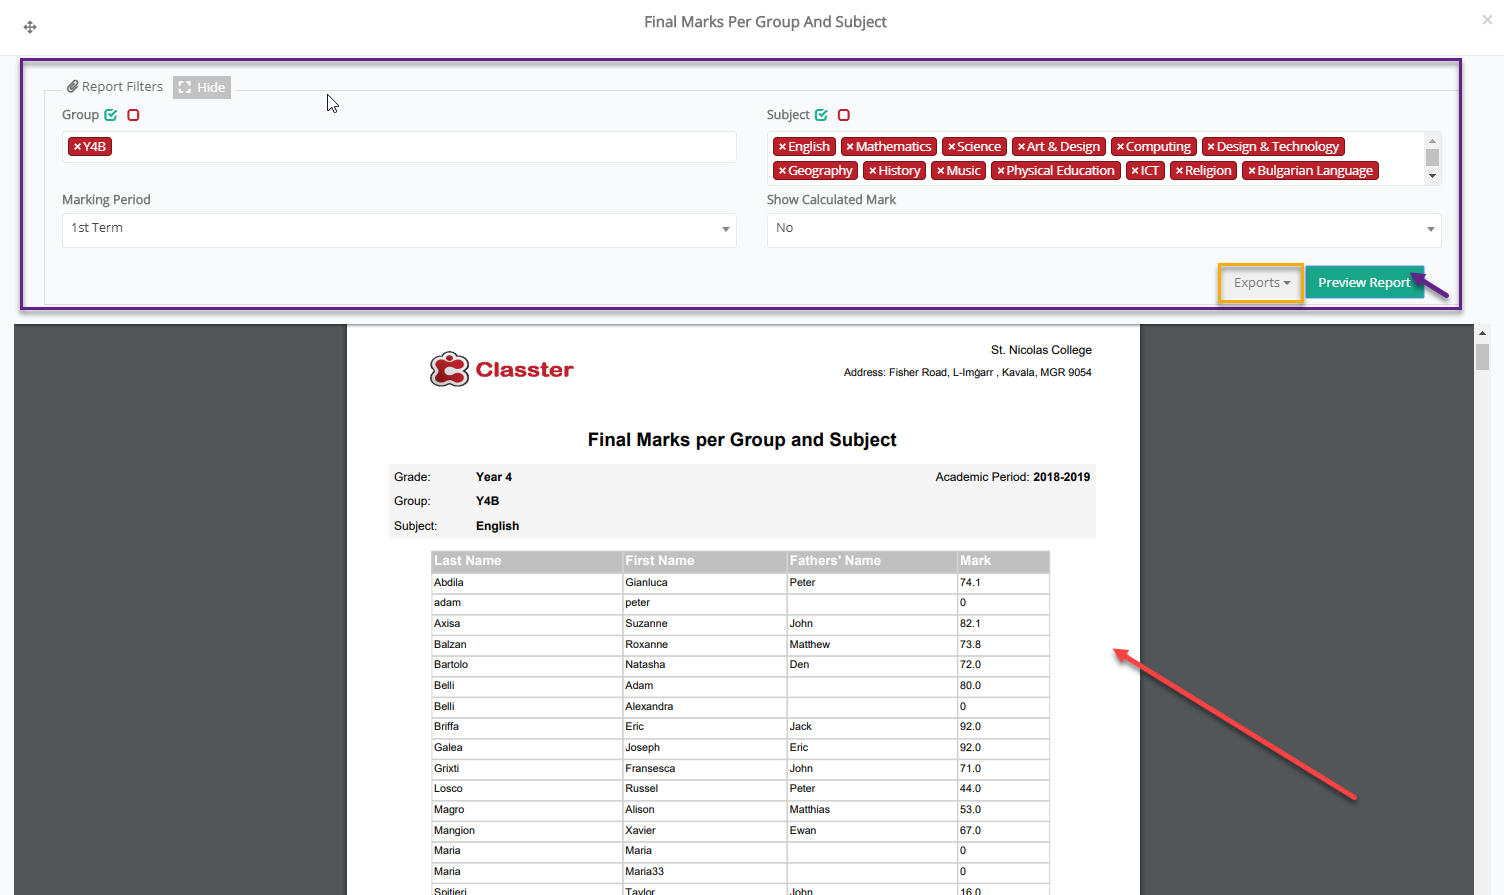
Figure 32
Term Marks Analysis
You can show mark analysis for the selected marking period and the selected subject students are enrolled in (Figure 33).
- Use the subject and marking period filters to show results.
- You can see results in a graph, presenting the percentage of students that are excellent, very good, average or fail in the selected subject i.e. Very Good 42.9%. Next to the graph you can see the previous information in numbers i.e. 6 students are very good. Additionally, you can see the subject’s average i.e. 67.7.
- In the Marking List, you can see analytically the students’ marks.Note: You can use the columns to filter or classify the results. The number in brackets next to Essay, Classwork, Exams and Personal Assessment is the category weight.
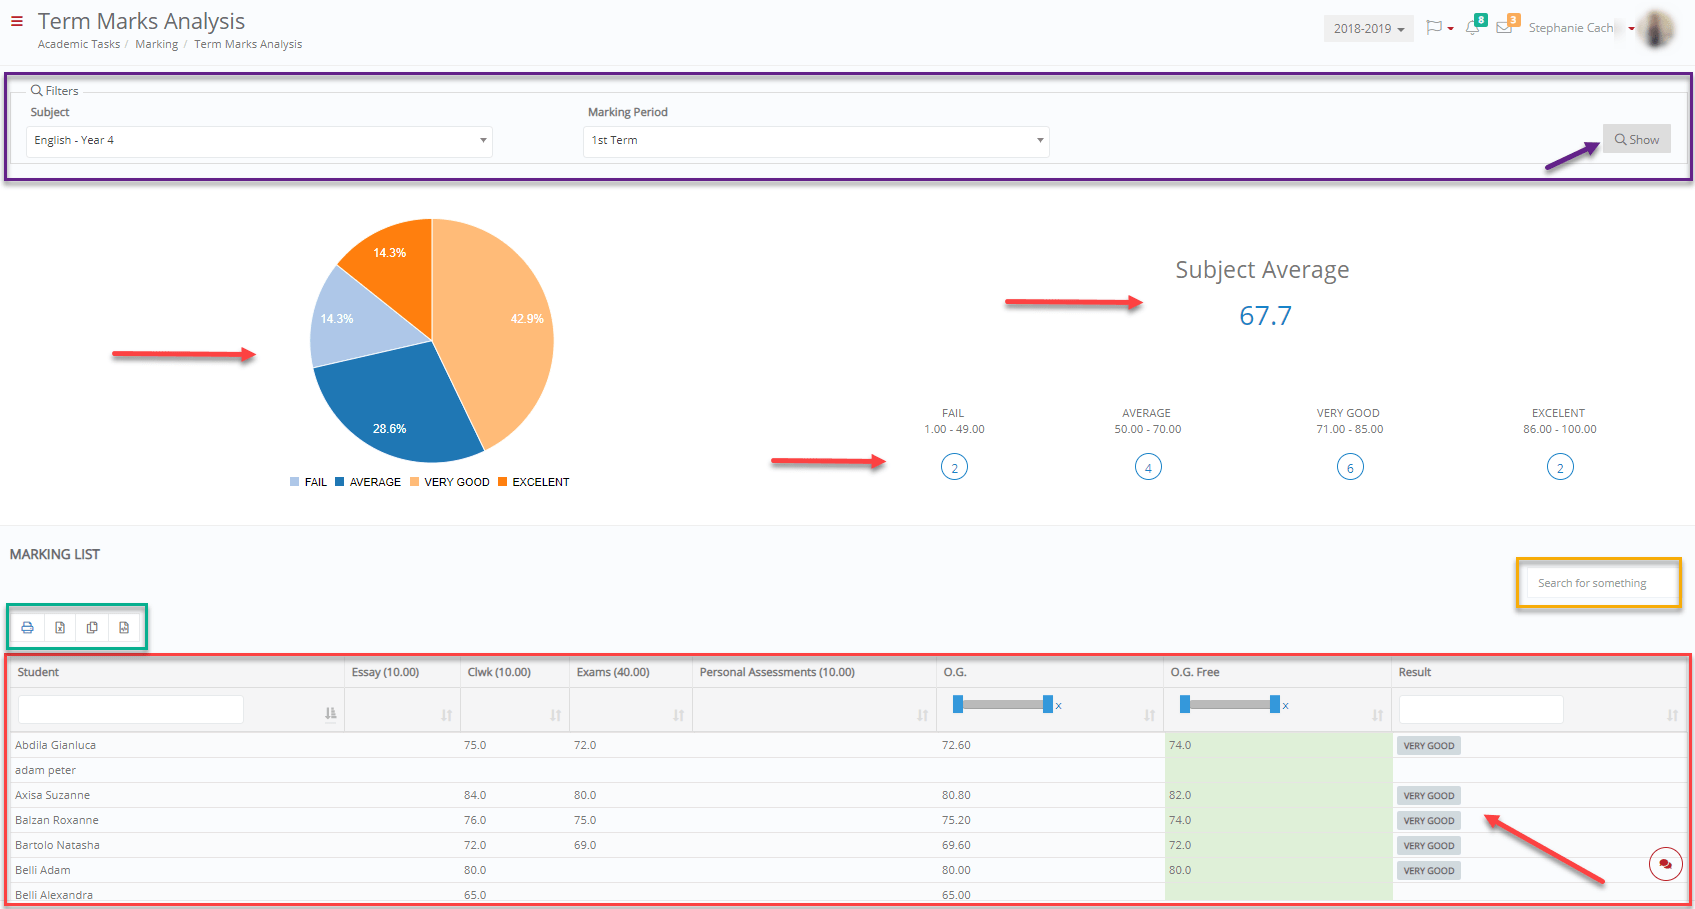
Figure 33
Descriptive Mark Analysis
You can show student’s descriptive marking analysis (e.g. grades, strengths, weaknesses etc.) Per Student, Per Distribution of Answers, or Growth Per Criteria.
Per Student
Use the filters to select Grade e.g. Year 4, Group/Class e.g. Y4B, Subject e.g. English-Year 4 and Marking Period e.g. 1st Term (Figure 34).
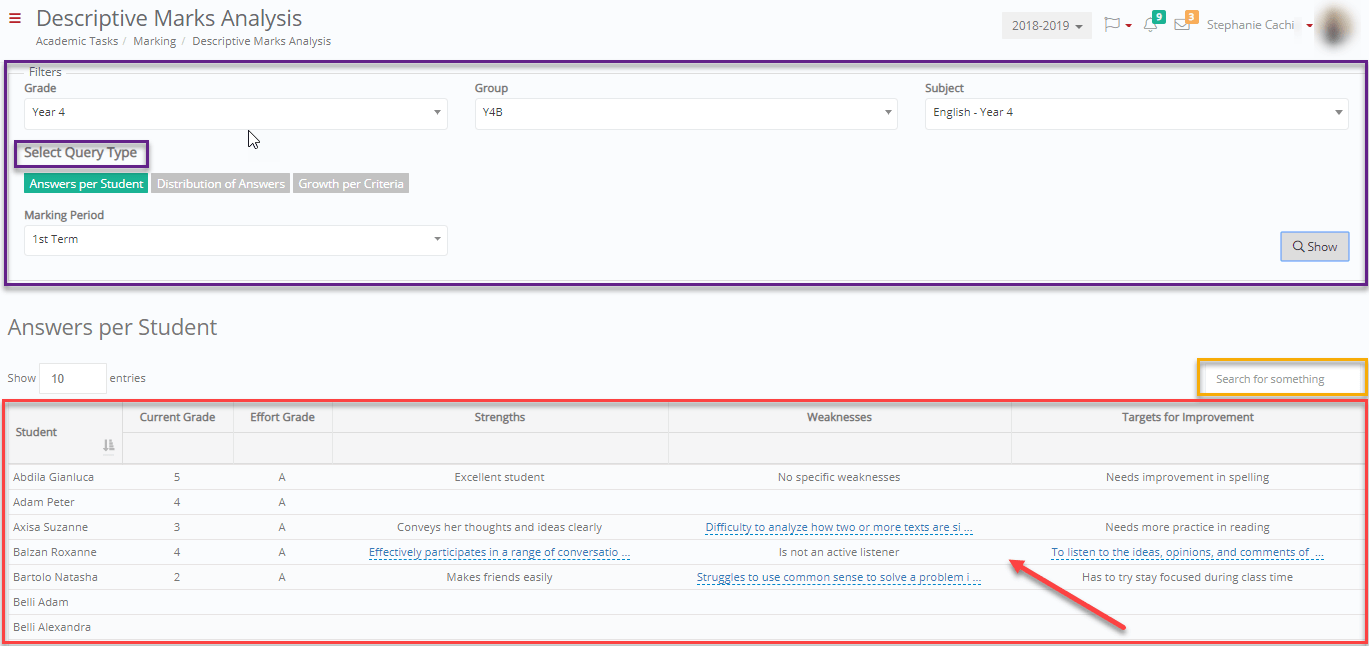
Figure 34
Note: Click on blue colored text to see the whole comment (Figure 35).
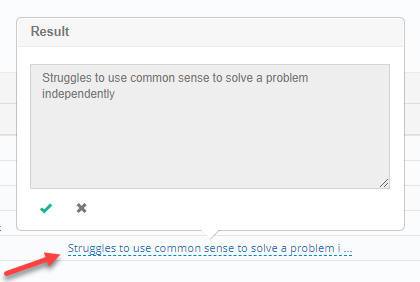
Figure 35
Distribution of answers
- Use the filters to select Year e.g Year 4, Group/Class e.g. Y4B, Subject e.g. Science-Year 4 and Marking Period e.g. 2nd Term (Figure 36).
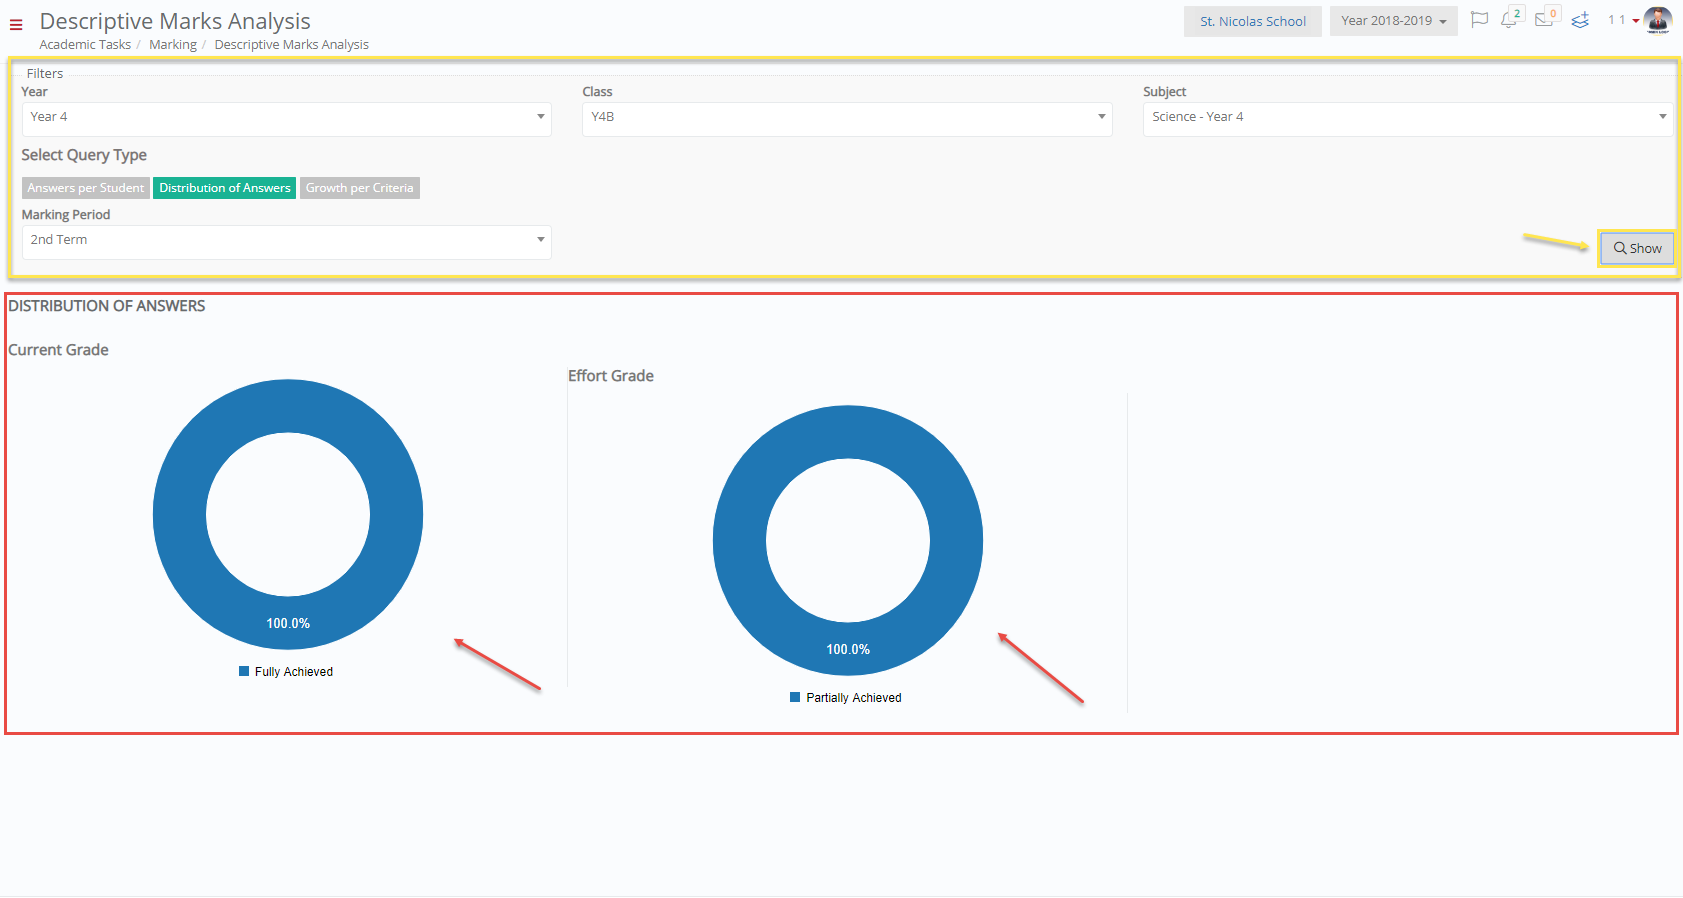
Figure 36
Distribution of answeres
- Use the filters to select Year e.g Year 4, Group/Class e.g. Y4B, Subject e.g. Science-Year 4 and Marking Period e.g. 2nd Term (Figure 37).
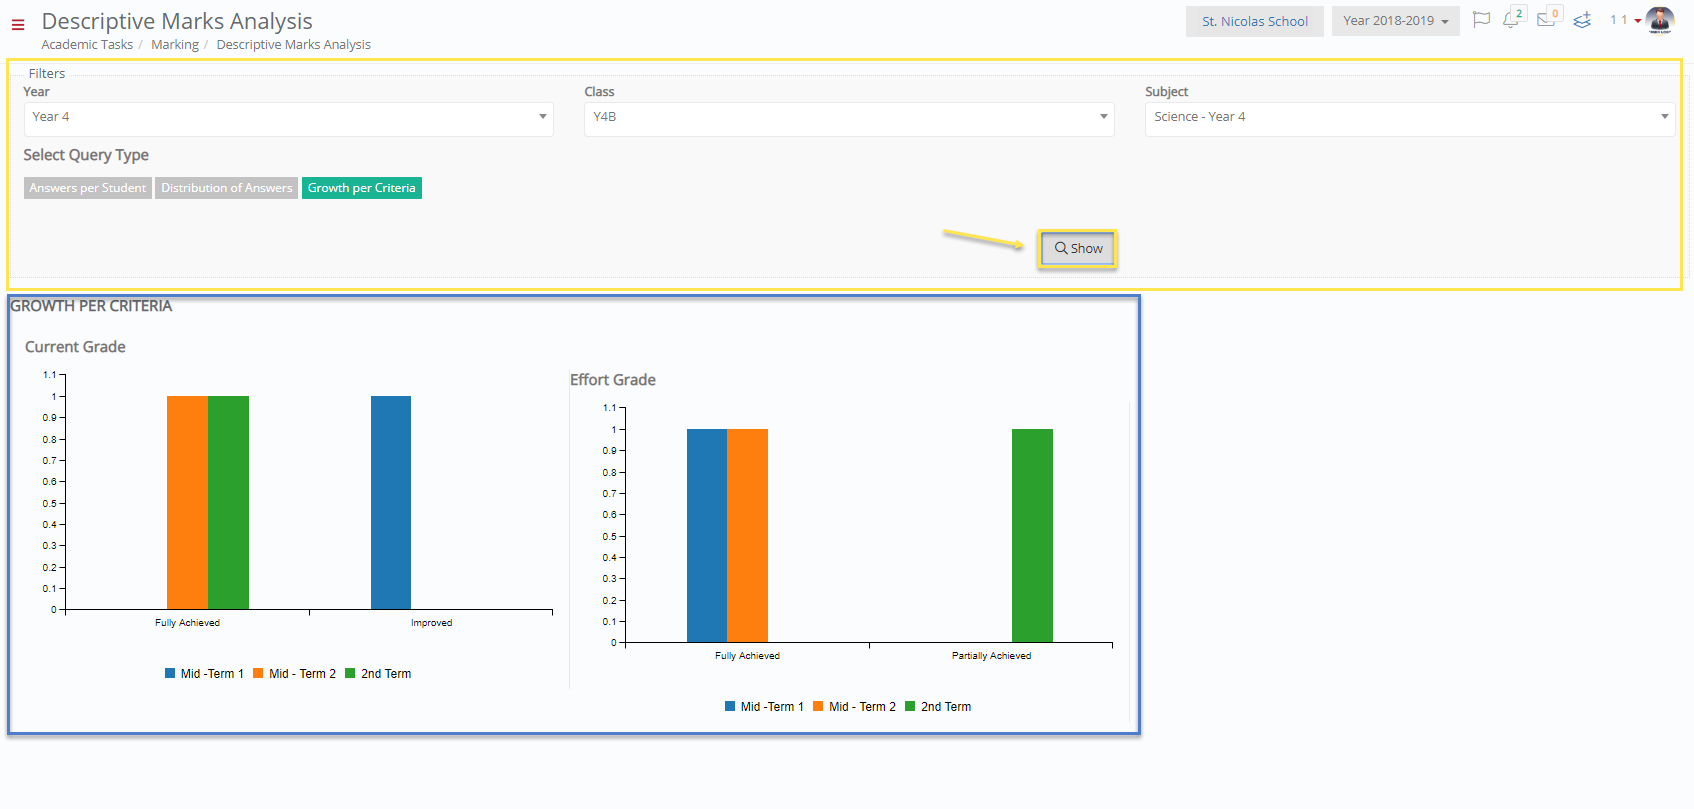
Figure 37
Overall Annual Results
Here you are able to view the results of a student’s performance throughout the Academic year (Figure 38).
- Use the Filters by choosing Year e.g Year 4, Promotion e.g Promoted, Graduation Status e.g All, Attendance e.g Normal and Conduct e,g All (Figure 38).
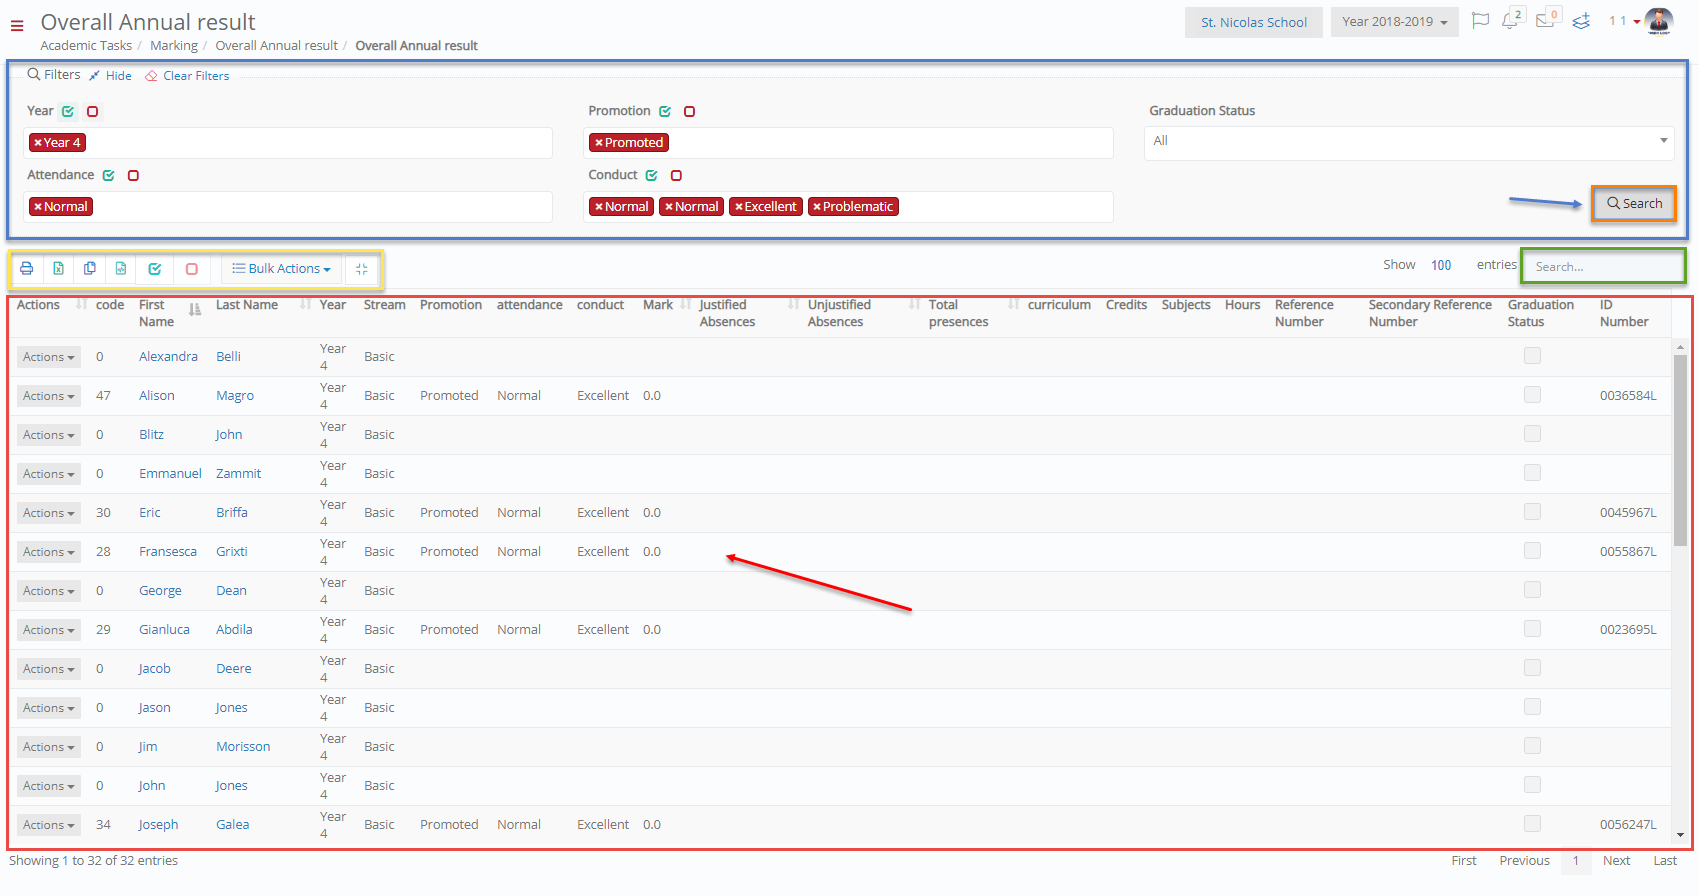
Figure 38
- Click on search to view results.
- Here you can see the results of students throughout the year (Figure 38).
- By clicking on the Bulk Actions button to Change Students Registration Status or to Calculate Annual Results (Figure 38).
- By clicking on the Action dropdown list next to each list entry you can Delete a Student or Edit Annual Result (Figure 39,40).
- You can use the Search text box to find any specific Student. You can also export and print the list by clicking on the export or print buttons next to the Bulk Action button (Figure 38).
- Print Official Certificate allows you to print a Certificate for a Student who was Promoted or Graduated (Figure 39).
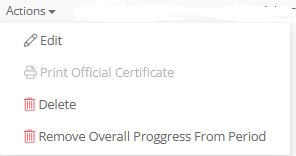
Figure 39
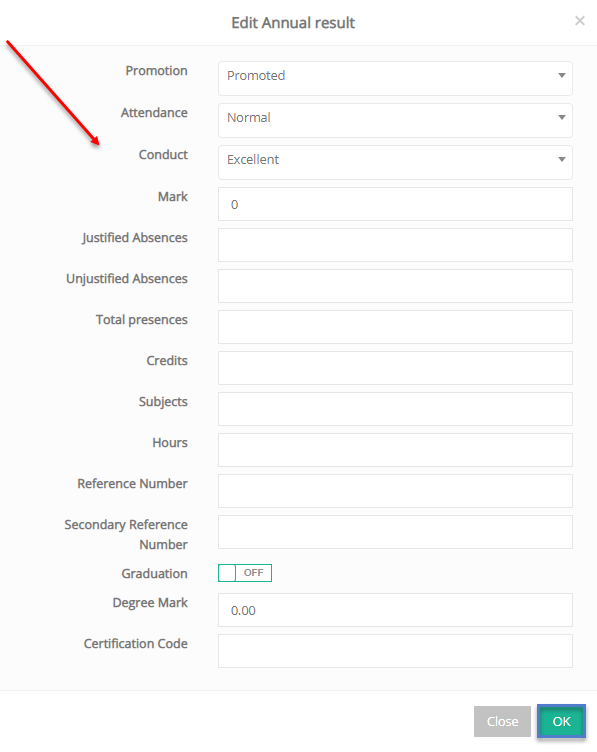
Figure 40
- You are able to change any field you want and then click on OK (Figure 40).
General Note for Section: Terms may appear differently in each institution according to their academic terminology. For printing, you must have an operational printer set up (fully loaded with ink cartridges). For exporting you must have installed PDF readers and the MS Office suite.