

Use the ‘Status’ menu to see students according to the select registration status e.g., all or the registered, transferred to another school, inactive ones etc. (Figure 178).
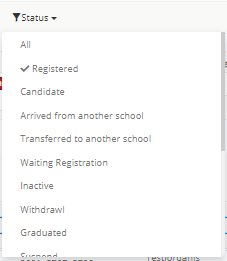
Figure 178
Actions

Use the Actions menu to perform mass imports and actions, and to perform transfer actions.
Note: Action’s menu has more options in Grid View, as you need to select or multiselect students you need to apply the actions to.

Figure 179
Create relatives
- Select two or more students and click on ‘Create Relatives’ to connect the students. The parents’ data will be merged, and a sibling will be created for the selected students.
At the Create Siblings pop-up window (Figure 180):
- Select the ‘Relative Type’ e.g., Siblings (in school)
- Enable the ‘Merge Parents’ setting if the selected students have the same father and mother
- Enable the ‘Living Together’ setting to state if the selected students are living together

Figure 180
Change student status
- Select ‘Change Student Status’, to change the status of the selected student(s) (Figure 181).

Figure 181
- Enter the date of status change
- Select the reason of change from the drop-down list e.g., Academic issues
- Select the new status e.g., Withdrawal
- Click on ‘Apply to all rows’ to update the registration of all the students to the selected status
- Click on ‘Save’
Note: You can view changes to the student’s status from the School Registration History in the student profile.

Figure 182
Enroll to Services
- Select ‘Enroll to services’ to enroll selected students to school services such as sports club, activities, transportation etc. (Figure 183).
- At the ‘Students’ field you can see the names of the selected students
- Select a services ‘Category’ e.g., sport clubs
- Select a ‘Service’ e.g., Tennis Club
- Select a ‘Time’ (if available – set by the admin) e.g., Monday – 14:30-15:30
- Click on the ‘Add’ button
At the bottom of the pop-up window, you can see the services entry.
Note: The ‘Start/End’ dates are editable.
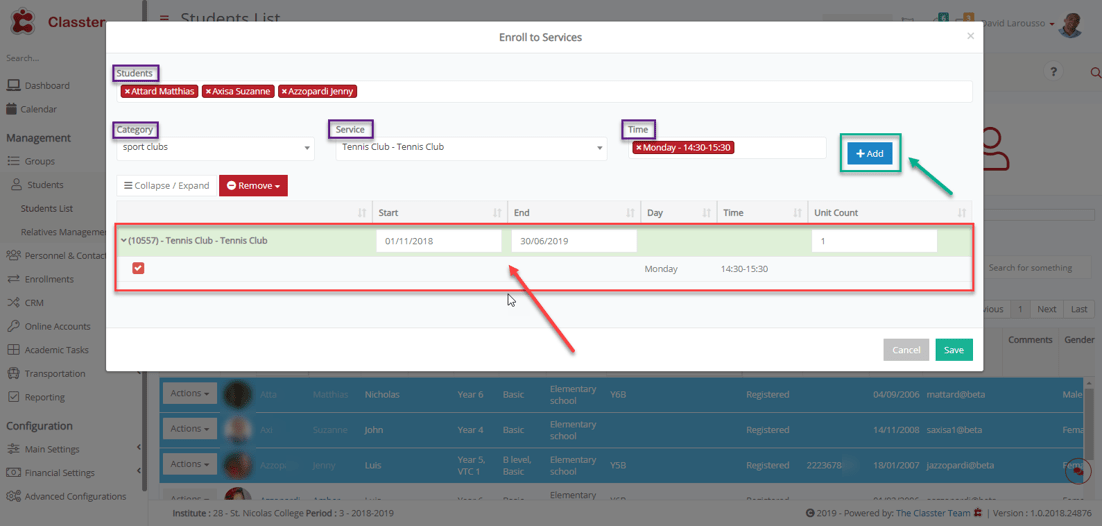
Figure 183
Anonymize
- Select ‘Anonymize’ to permanently replace student’s data by asterisks. It can be used for data privacy reasons (GDPR) once the student has graduated or left the school.
Note: You will not be able to undo and recreate the original data after being anonymized.
Student Registration Statistics
- Select ‘Student Registration Statistics’ to produce various statistics related to registration status of the selected students.
- Click on Show/Hide to expand the available filters to be used to produce the statistics (Figure 184):

Figure 184
- Select Company, Grade and Stream
- Select a Period from the available drop-down list and click on ‘Add Period’. Set the exact time using the ‘From date’, ‘To date’ fields.
Note: You can select more than one periods if you want to compare different periods
- Select a column type and click on ‘Add New’:
- Use the ‘Label’ text box to enter a column name
- Column type ‘Data column’ – to add a column that will show the data you want:
- Use the ‘Status’ drop-down list, to select which students’ status you want to see in the results e.g., Registered
- Use the ‘Status Type’ drop-down list, to select a status type between ‘First (i.e., will show students whose initial status logged in the selected time, is ‘Registered’), Final (i.e., will show students whose last status, logged in the selected time, is ‘Registered’), and Any’ (i.e., will show students with a ‘Registered’ status, at any time of the selected time).
- Use the ‘Re-registrations’ drop-down list to select if you want to see Re-registrations or not. ‘Yes’ will only show re-registrations i.e., students who were initially registered in a previous period and they continued (transferred) to the selected period, ‘No’ will only show new registrations i.e., students who were registered for the first time at the selected period, and ‘All’ will show both.
- Column type ‘Functional’ – to be able to make calculations between columns e.g., Column 1 + Column 2
Note:
- You can use addition, subtraction, division, or multiplication.
- Use the column codes and not the column labels in your function.
- Select the data view order you want from the ‘View by’ filter e.g., View by ‘Company’ (Figure 185) or View by ‘Grade’ (Figure 186) etc.
- Click on the ‘X’ button if you want to delete a column.
- Click on ‘Save’ to save filters.
- Click on ‘Show’ to see results.
By company:

Figure 185
By Grade:

Figure 186
- Click on the Excel button to export the results in MS Excel